Tag: US inflation

  • The Evolving Dynamics of the US Oil Market

    The Evolving Dynamics of the US Oil Market

    The global oil market finds itself navigating uncertain waters as U.S. policies and broader geopolitical developments continue to shape its trajectory. At the center of this uncertainty is the impact of proposed tariffs by President Trump, which could fundamentally alter the supply and demand dynamics of oil in both domestic and international markets.

    Click for concise version

    The Tariff Effect: A Double-Edged Sword

    President Trump’s proposed tariffs on imports from Canada, Mexico, and other nations promise to shake the oil market to its core. These policies, aimed at addressing trade imbalances, may inadvertently raise U.S. gasoline prices by $0.25 to $0.75 per gallon due to retaliatory measures and increased production costs. The uncertainty surrounding these measures has already begun to influence crude oil prices, with analysts warning of fluctuations and volatility.

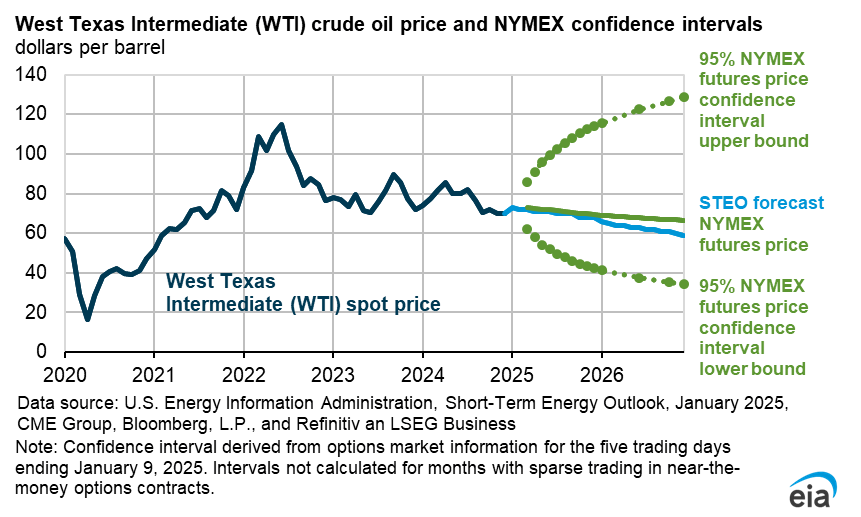
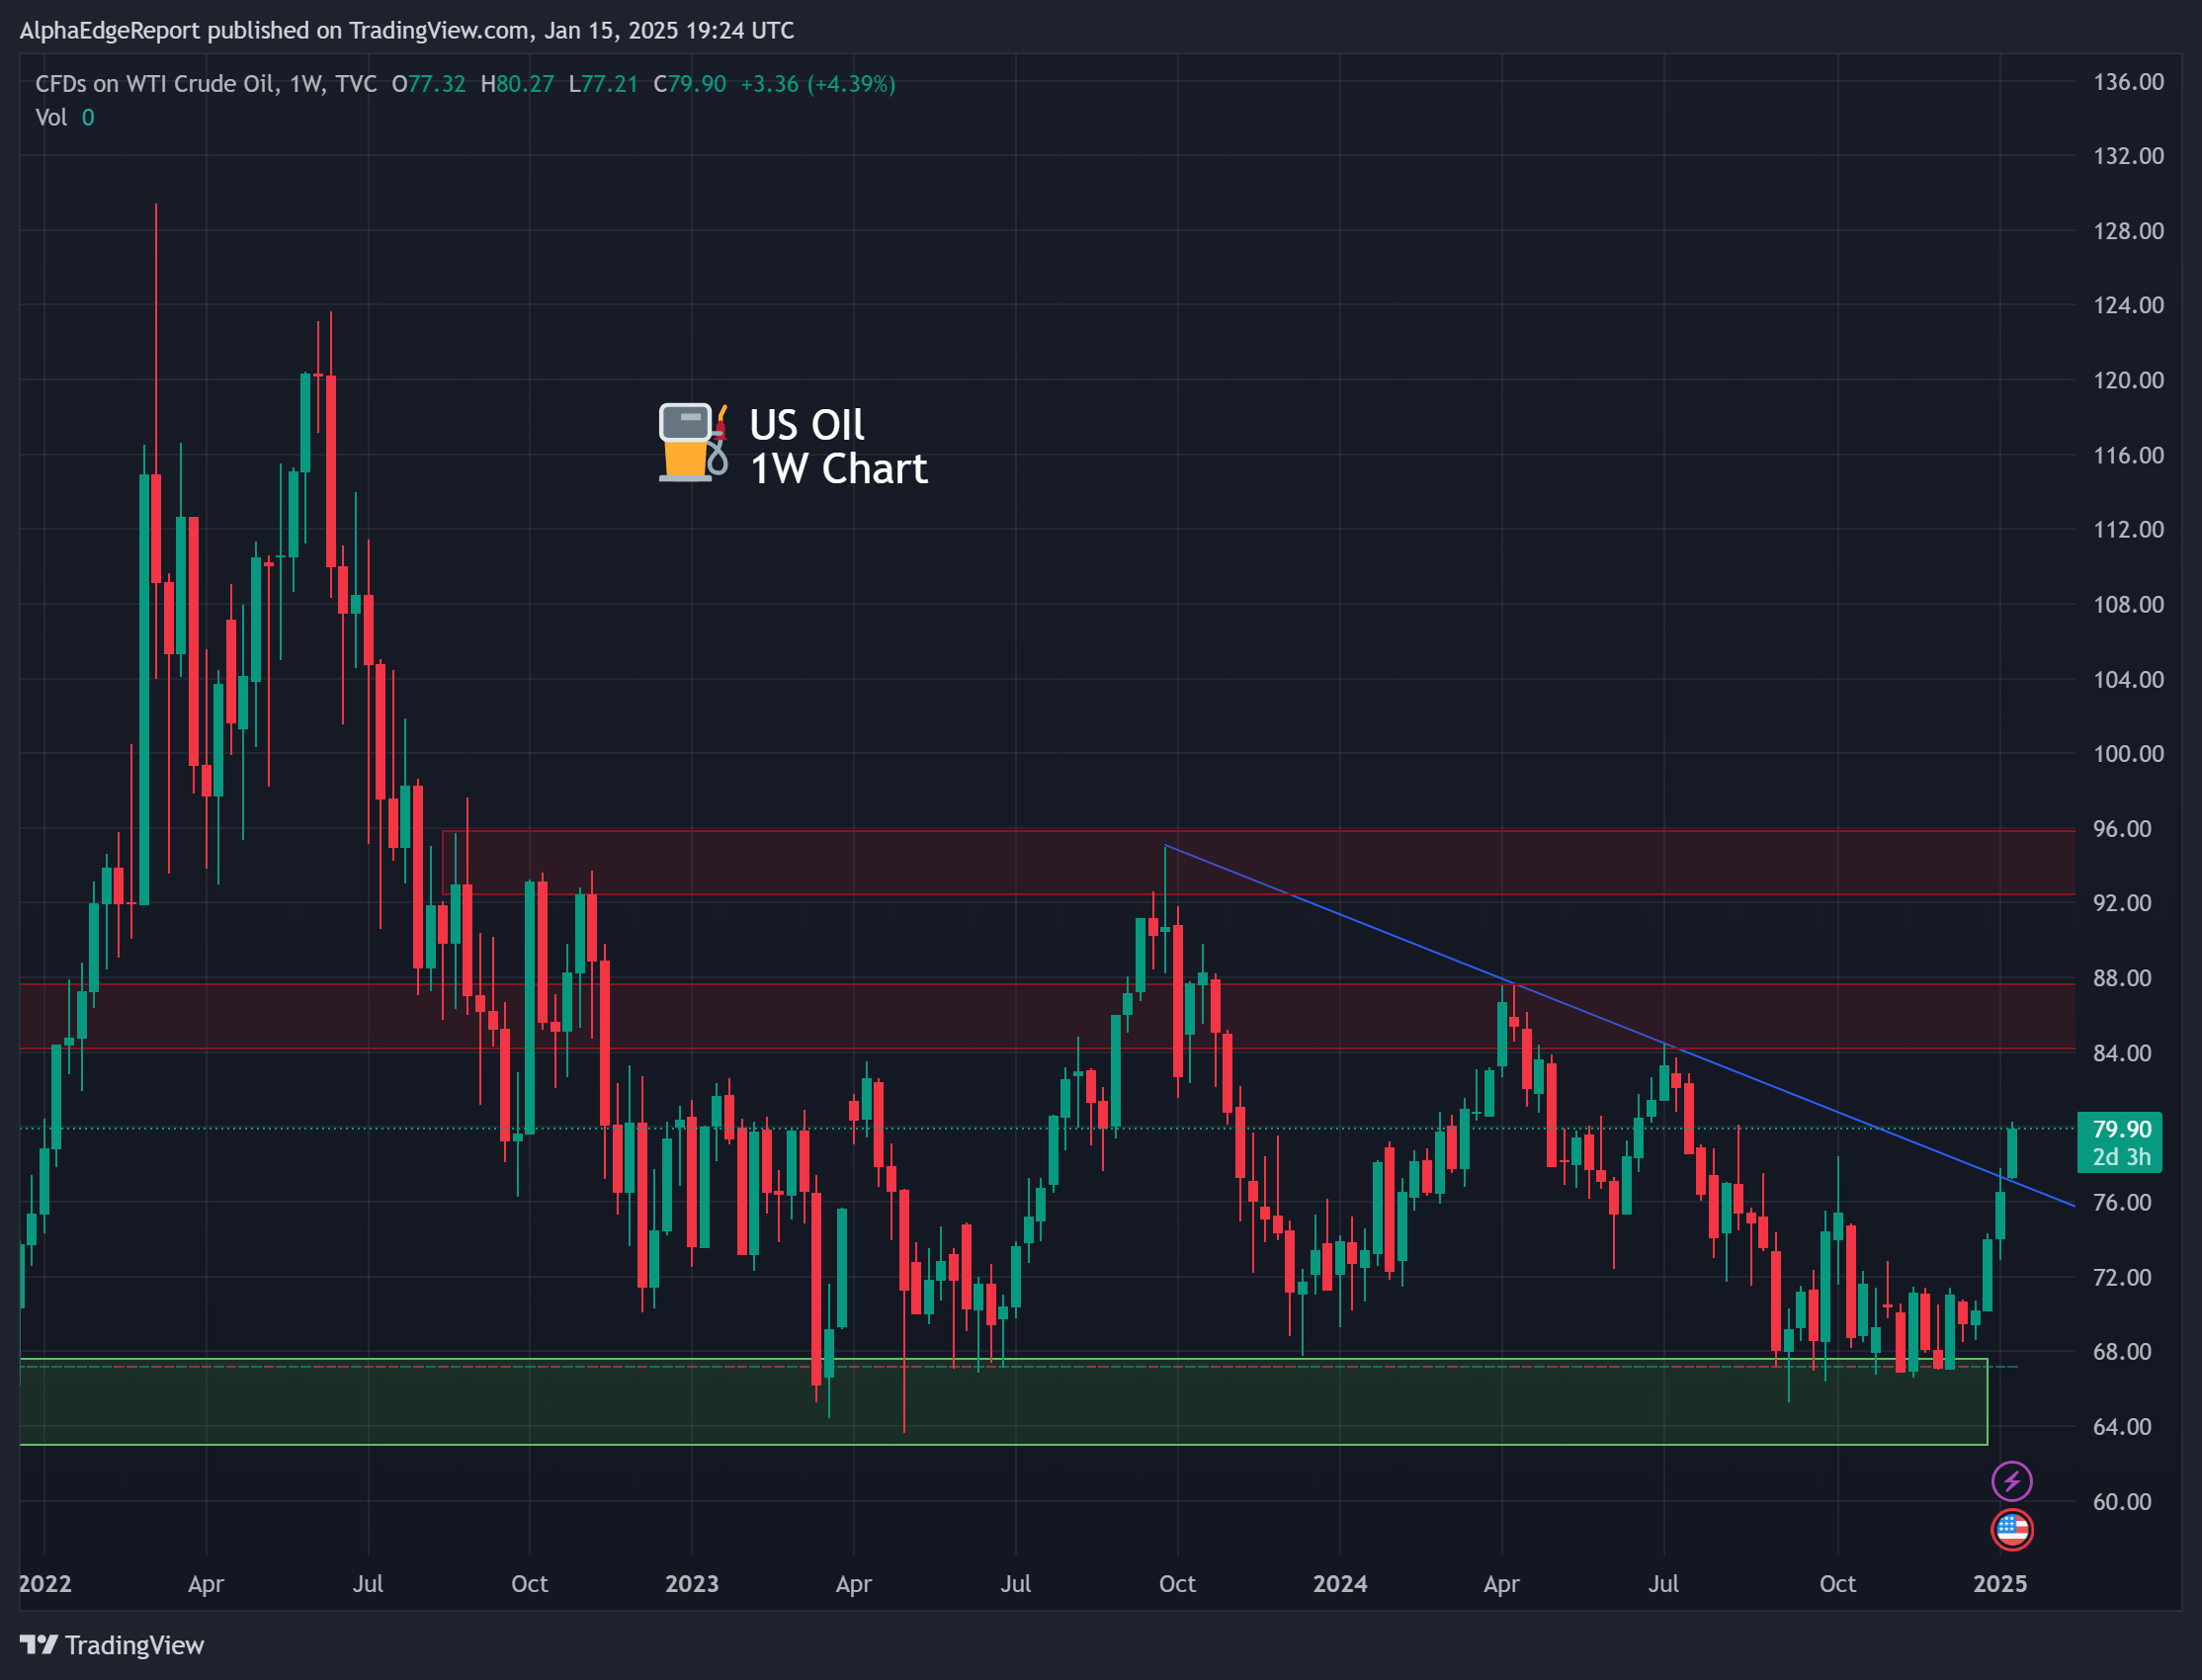
    Globally, the ripple effect of these tariffs could create supply disruptions while dampening demand growth. WTI crude oil, trading around $75 per barrel, remains under pressure as markets grapple with these evolving challenges. While increased U.S. production could offset some of the adverse effects, the broader economic implications suggest a prolonged period of instability.

    Price Trends: Mixed Signals in a Volatile Market

    WTI crude oil currently hovers at $75 per barrel, constrained by competing market forces. On the one hand, easing geopolitical tensions in regions like Gaza have tempered fears of supply disruptions. On the other, growing U.S. crude stockpiles exert downward pressure.

    Key price levels provide a glimpse into the market’s short-term trajectory:

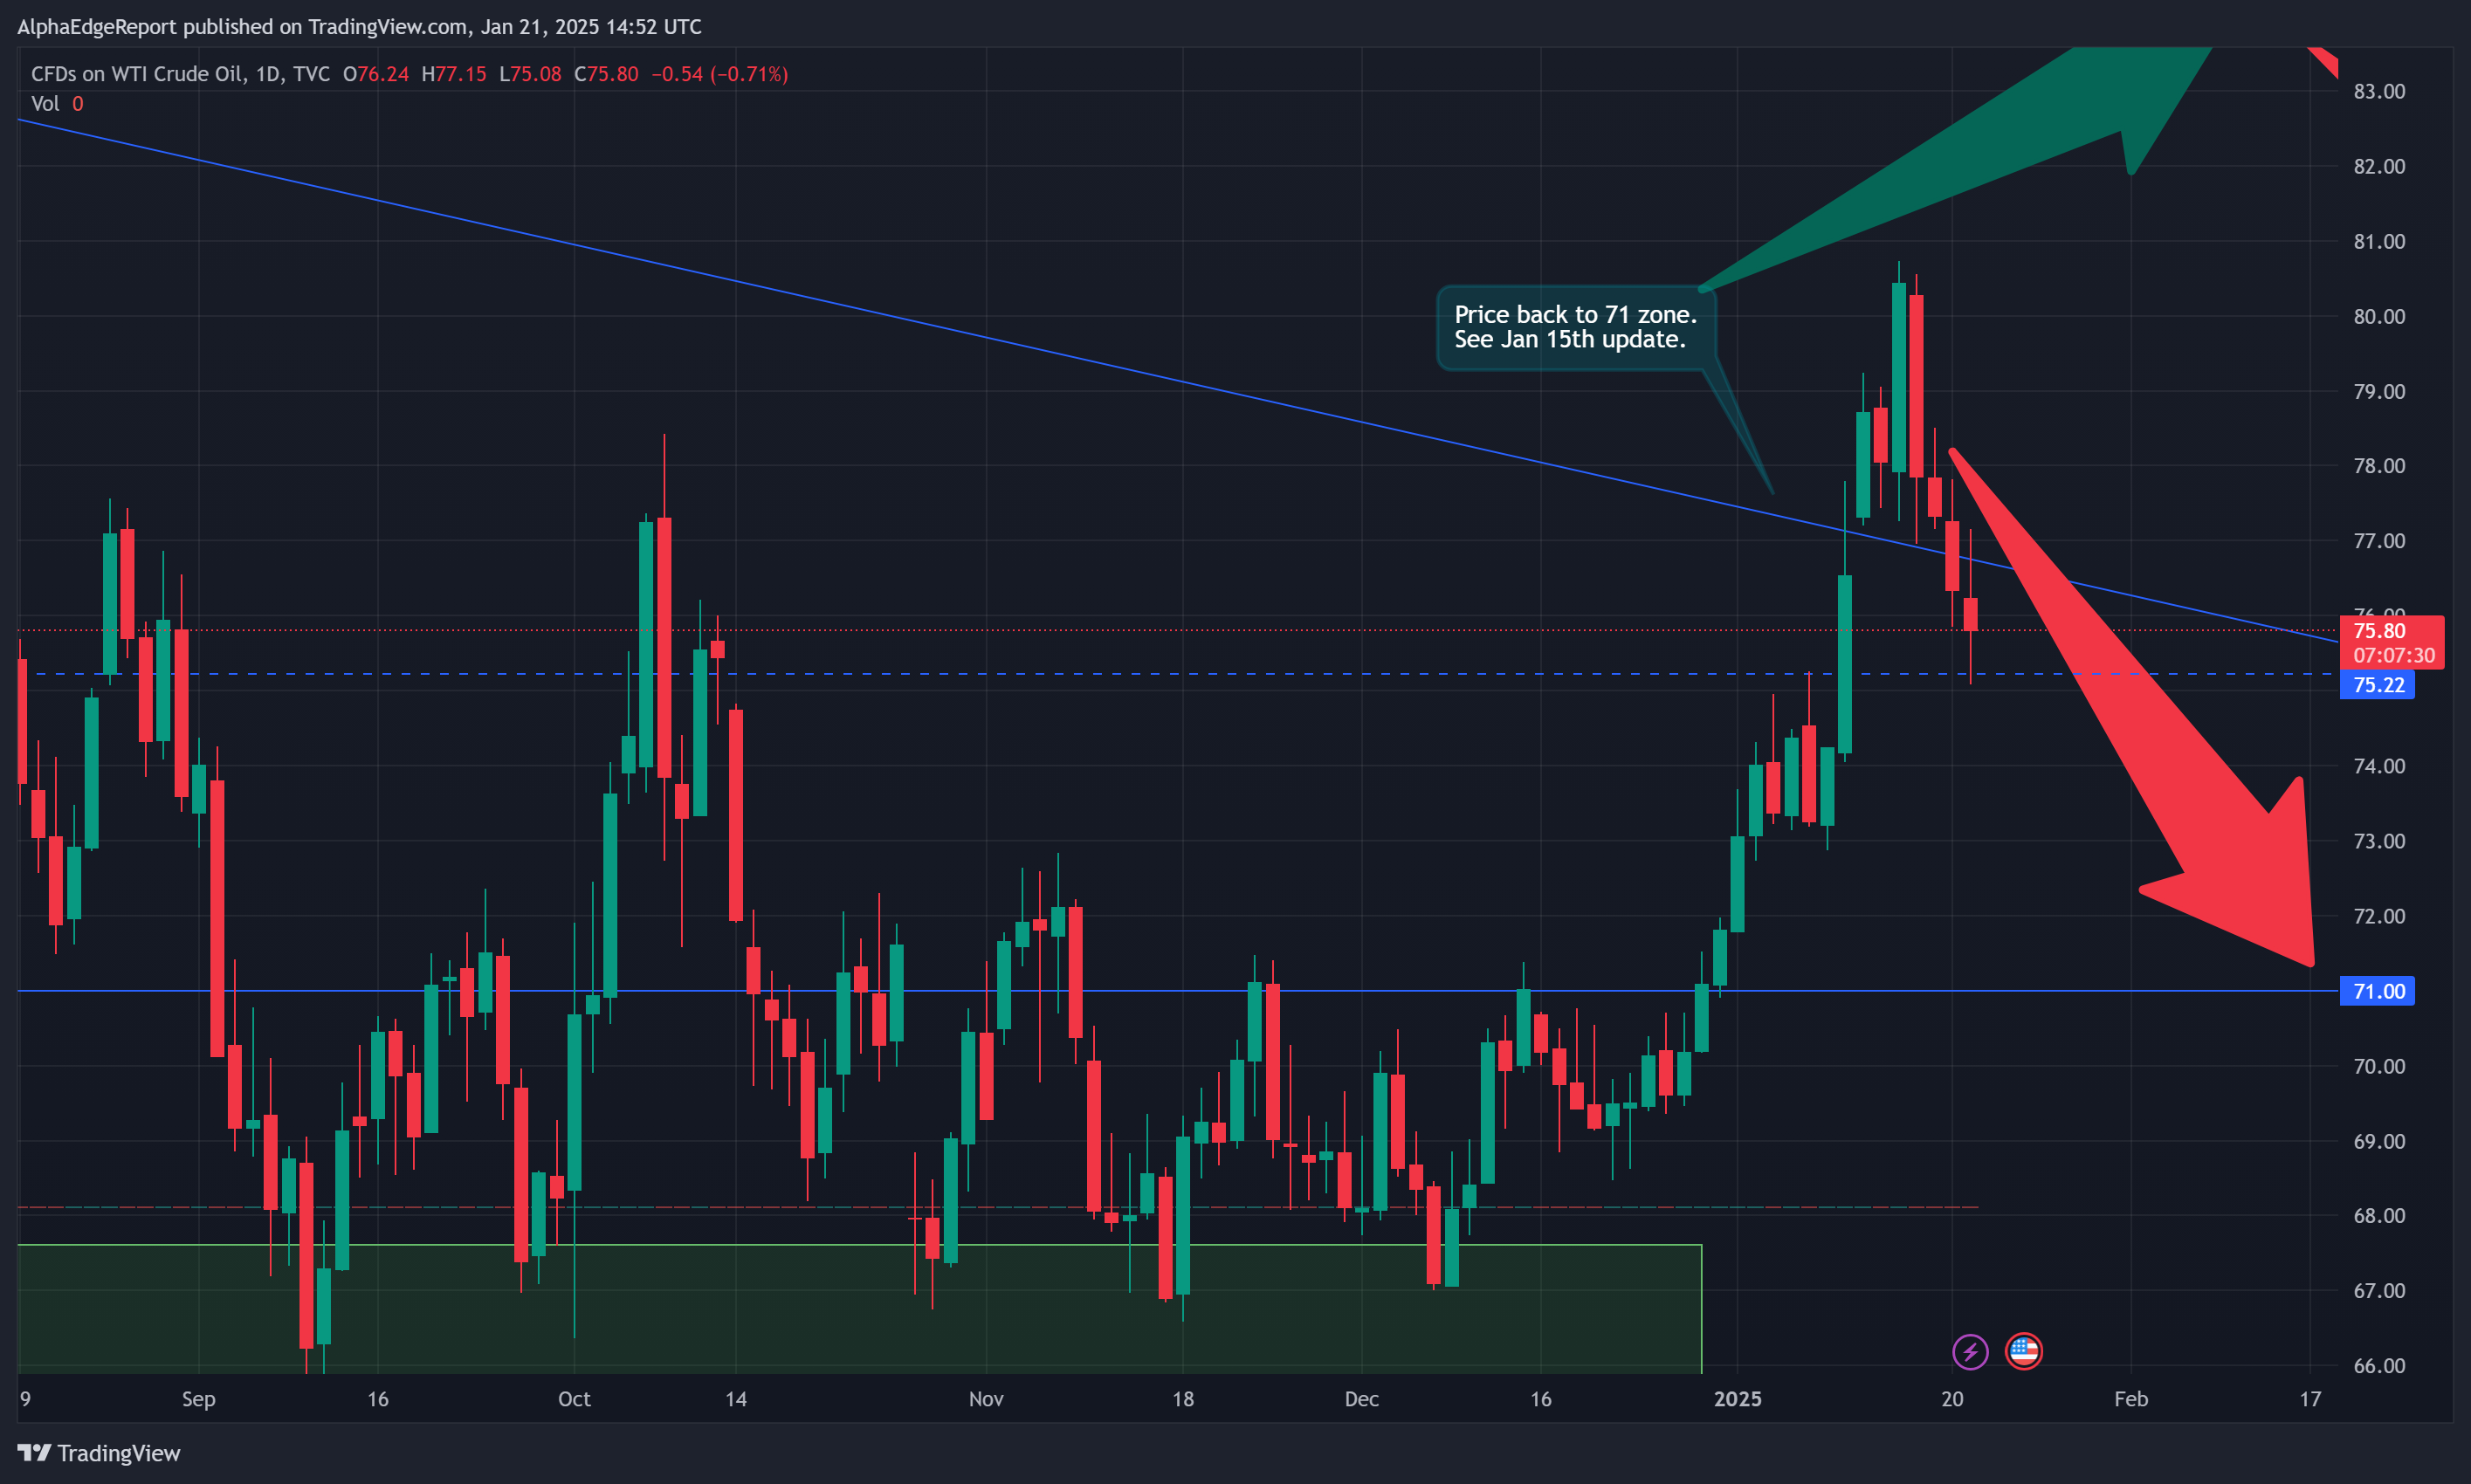
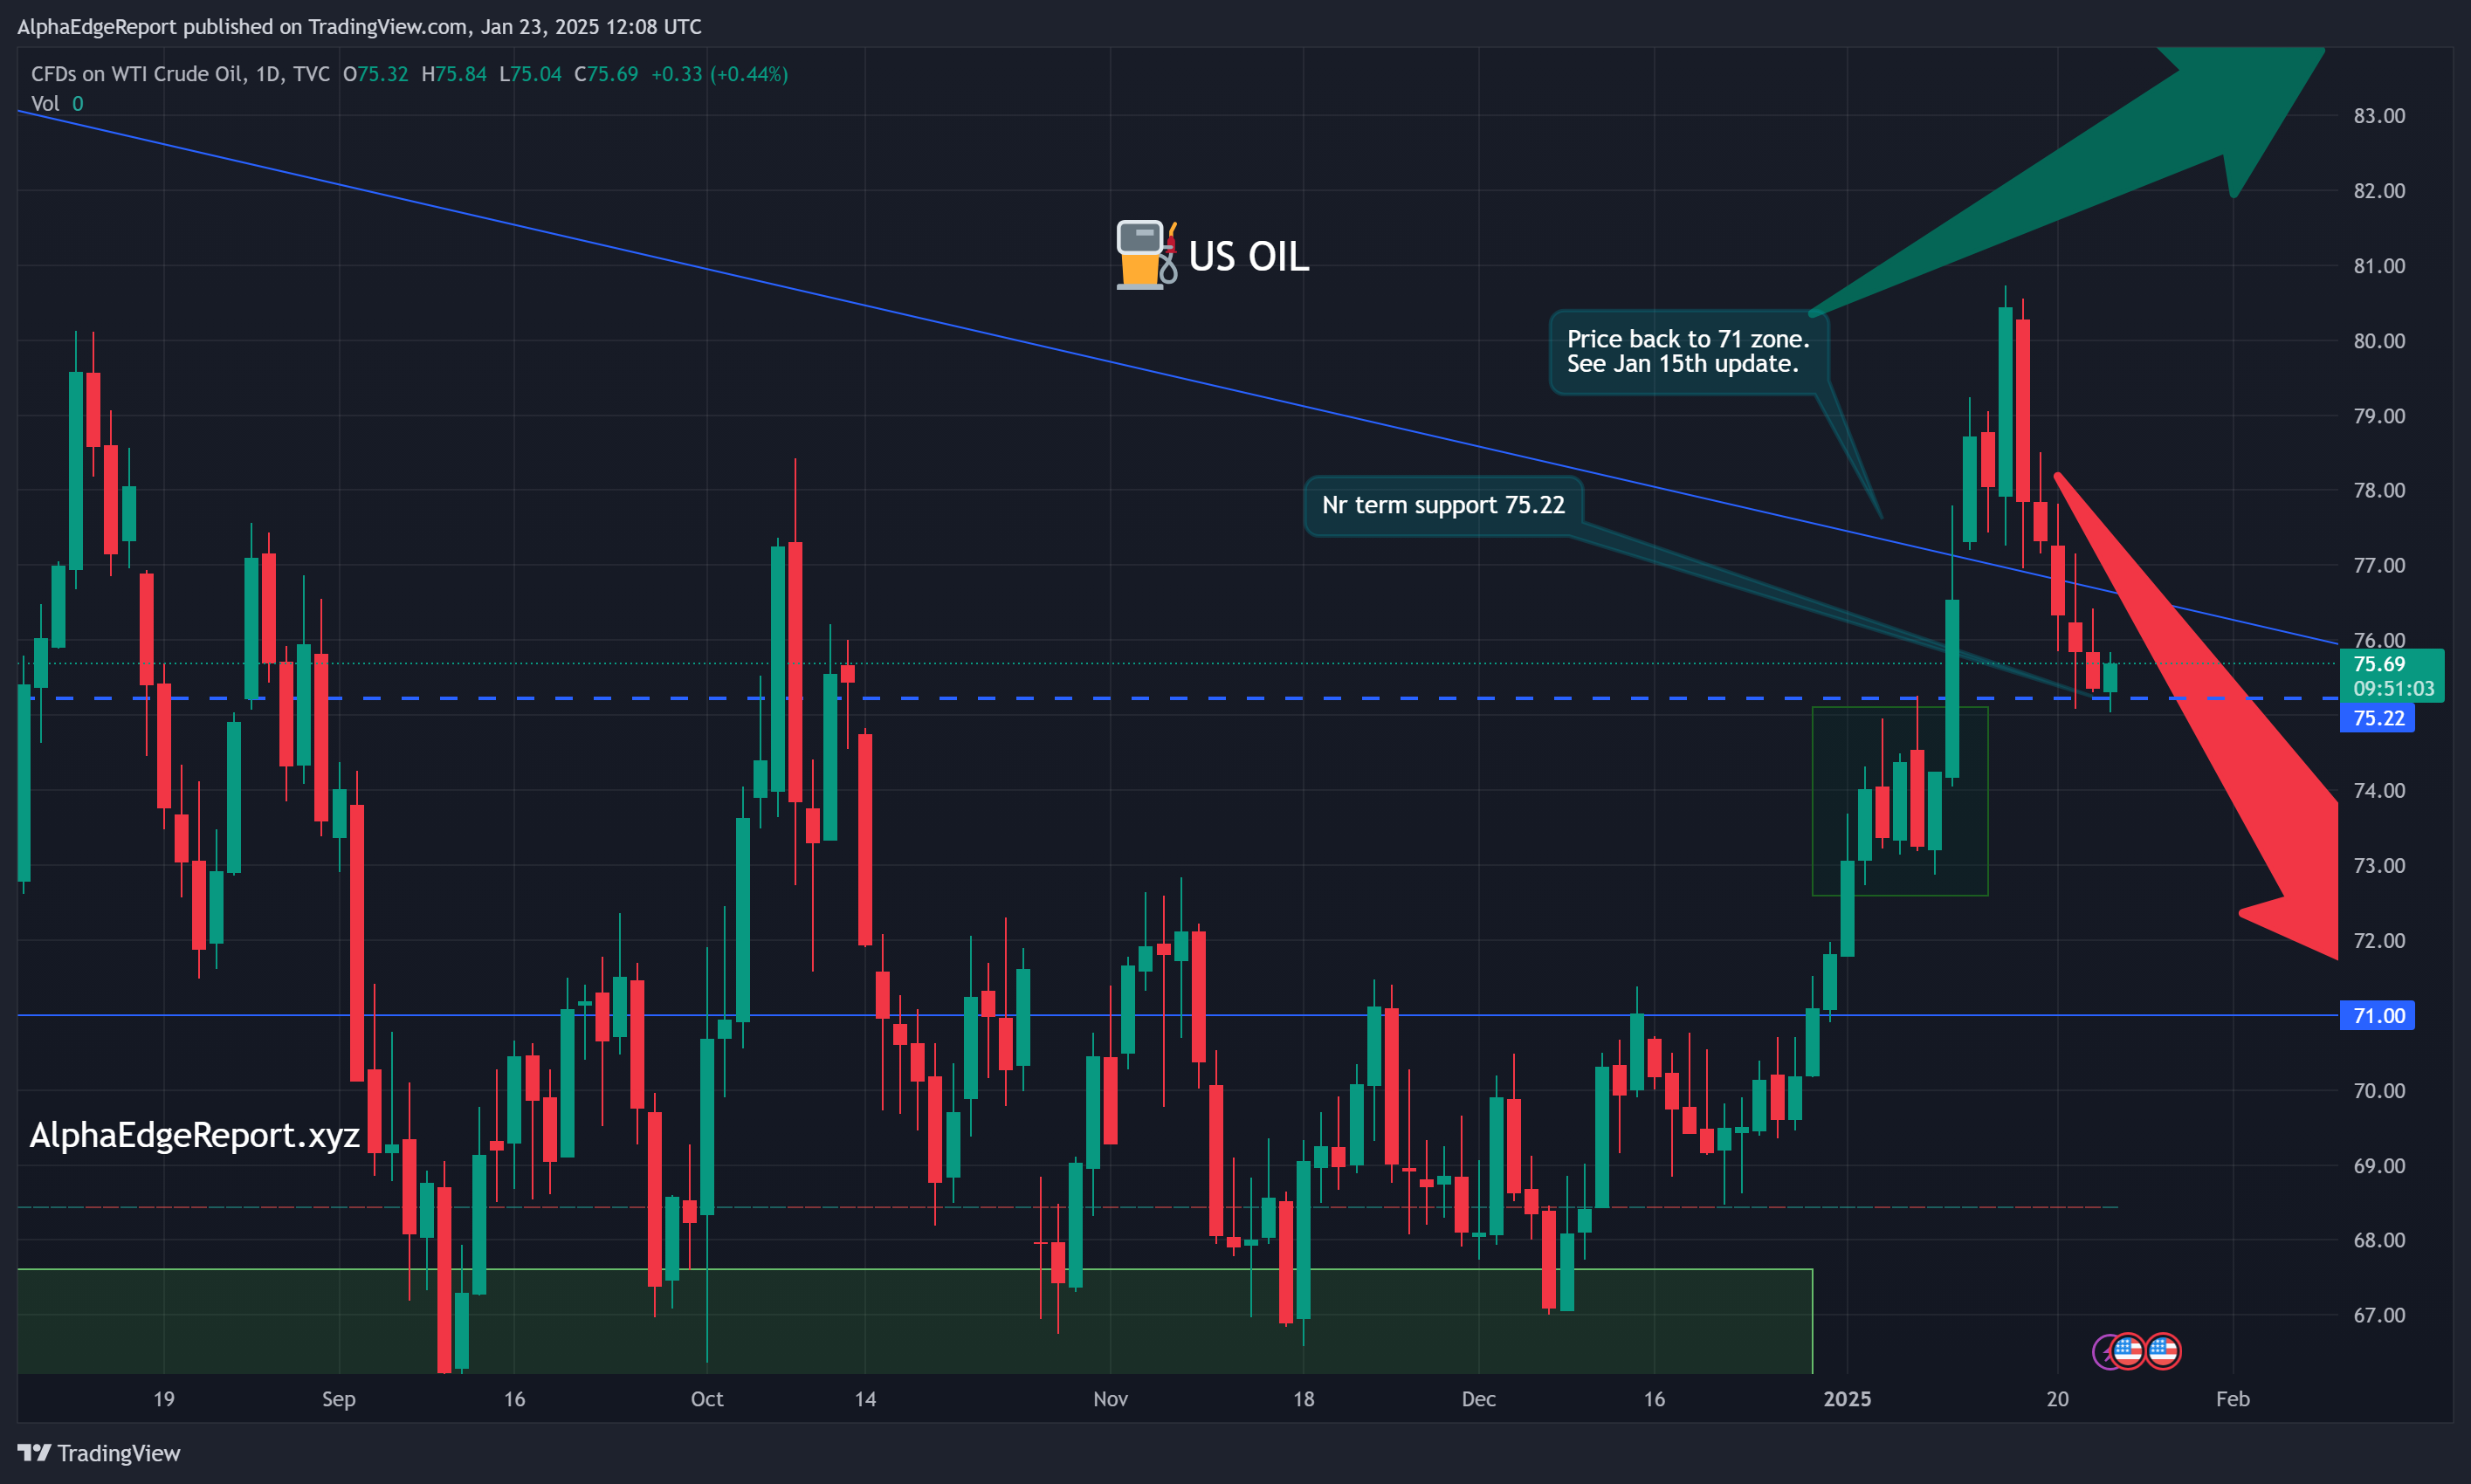
    Support: Prices find buyers around the $70-$72 range, a critical level that has historically signaled a rebound.

    Resistance: Selling pressure is evident at the $78-$80 zone, keeping prices from breaking out.

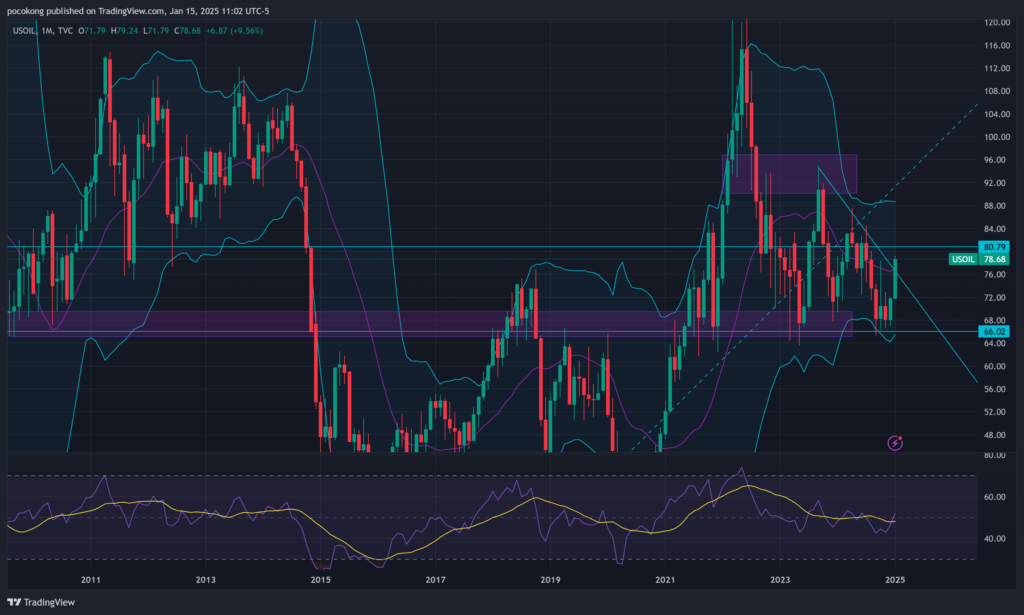
    Technically, the market remains at a crossroads. The infamous “death cross,” where the 50-day exponential moving average (EMA) remains below the 200-day moving average, underscores the bearish sentiment. Yet, indicators like Bollinger Bands and the Relative Strength Index (RSI) suggest pockets of optimism, pointing to potential bounce zones around $75-$76. The MACD, meanwhile, offers a glimmer of bullish hope, reflecting underlying momentum.

    Inventory Builds and the Supply Conundrum

    The U.S. oil inventory picture reveals a steady increase in crude and refined products, signaling robust supply. In the week ending January 17:

    Crude stocks rose by 958,000 barrels.

    Gasoline inventories surged by 3.23 million barrels.

    Distillate stocks increased by 1.88 million barrels.

    These builds further reinforce the downward pressure on oil prices, particularly as U.S. energy policies prioritize ramping up domestic production. President Trump’s energy emergency declaration, which aims to streamline infrastructure development and ease environmental restrictions, is expected to support higher output levels in the near term.

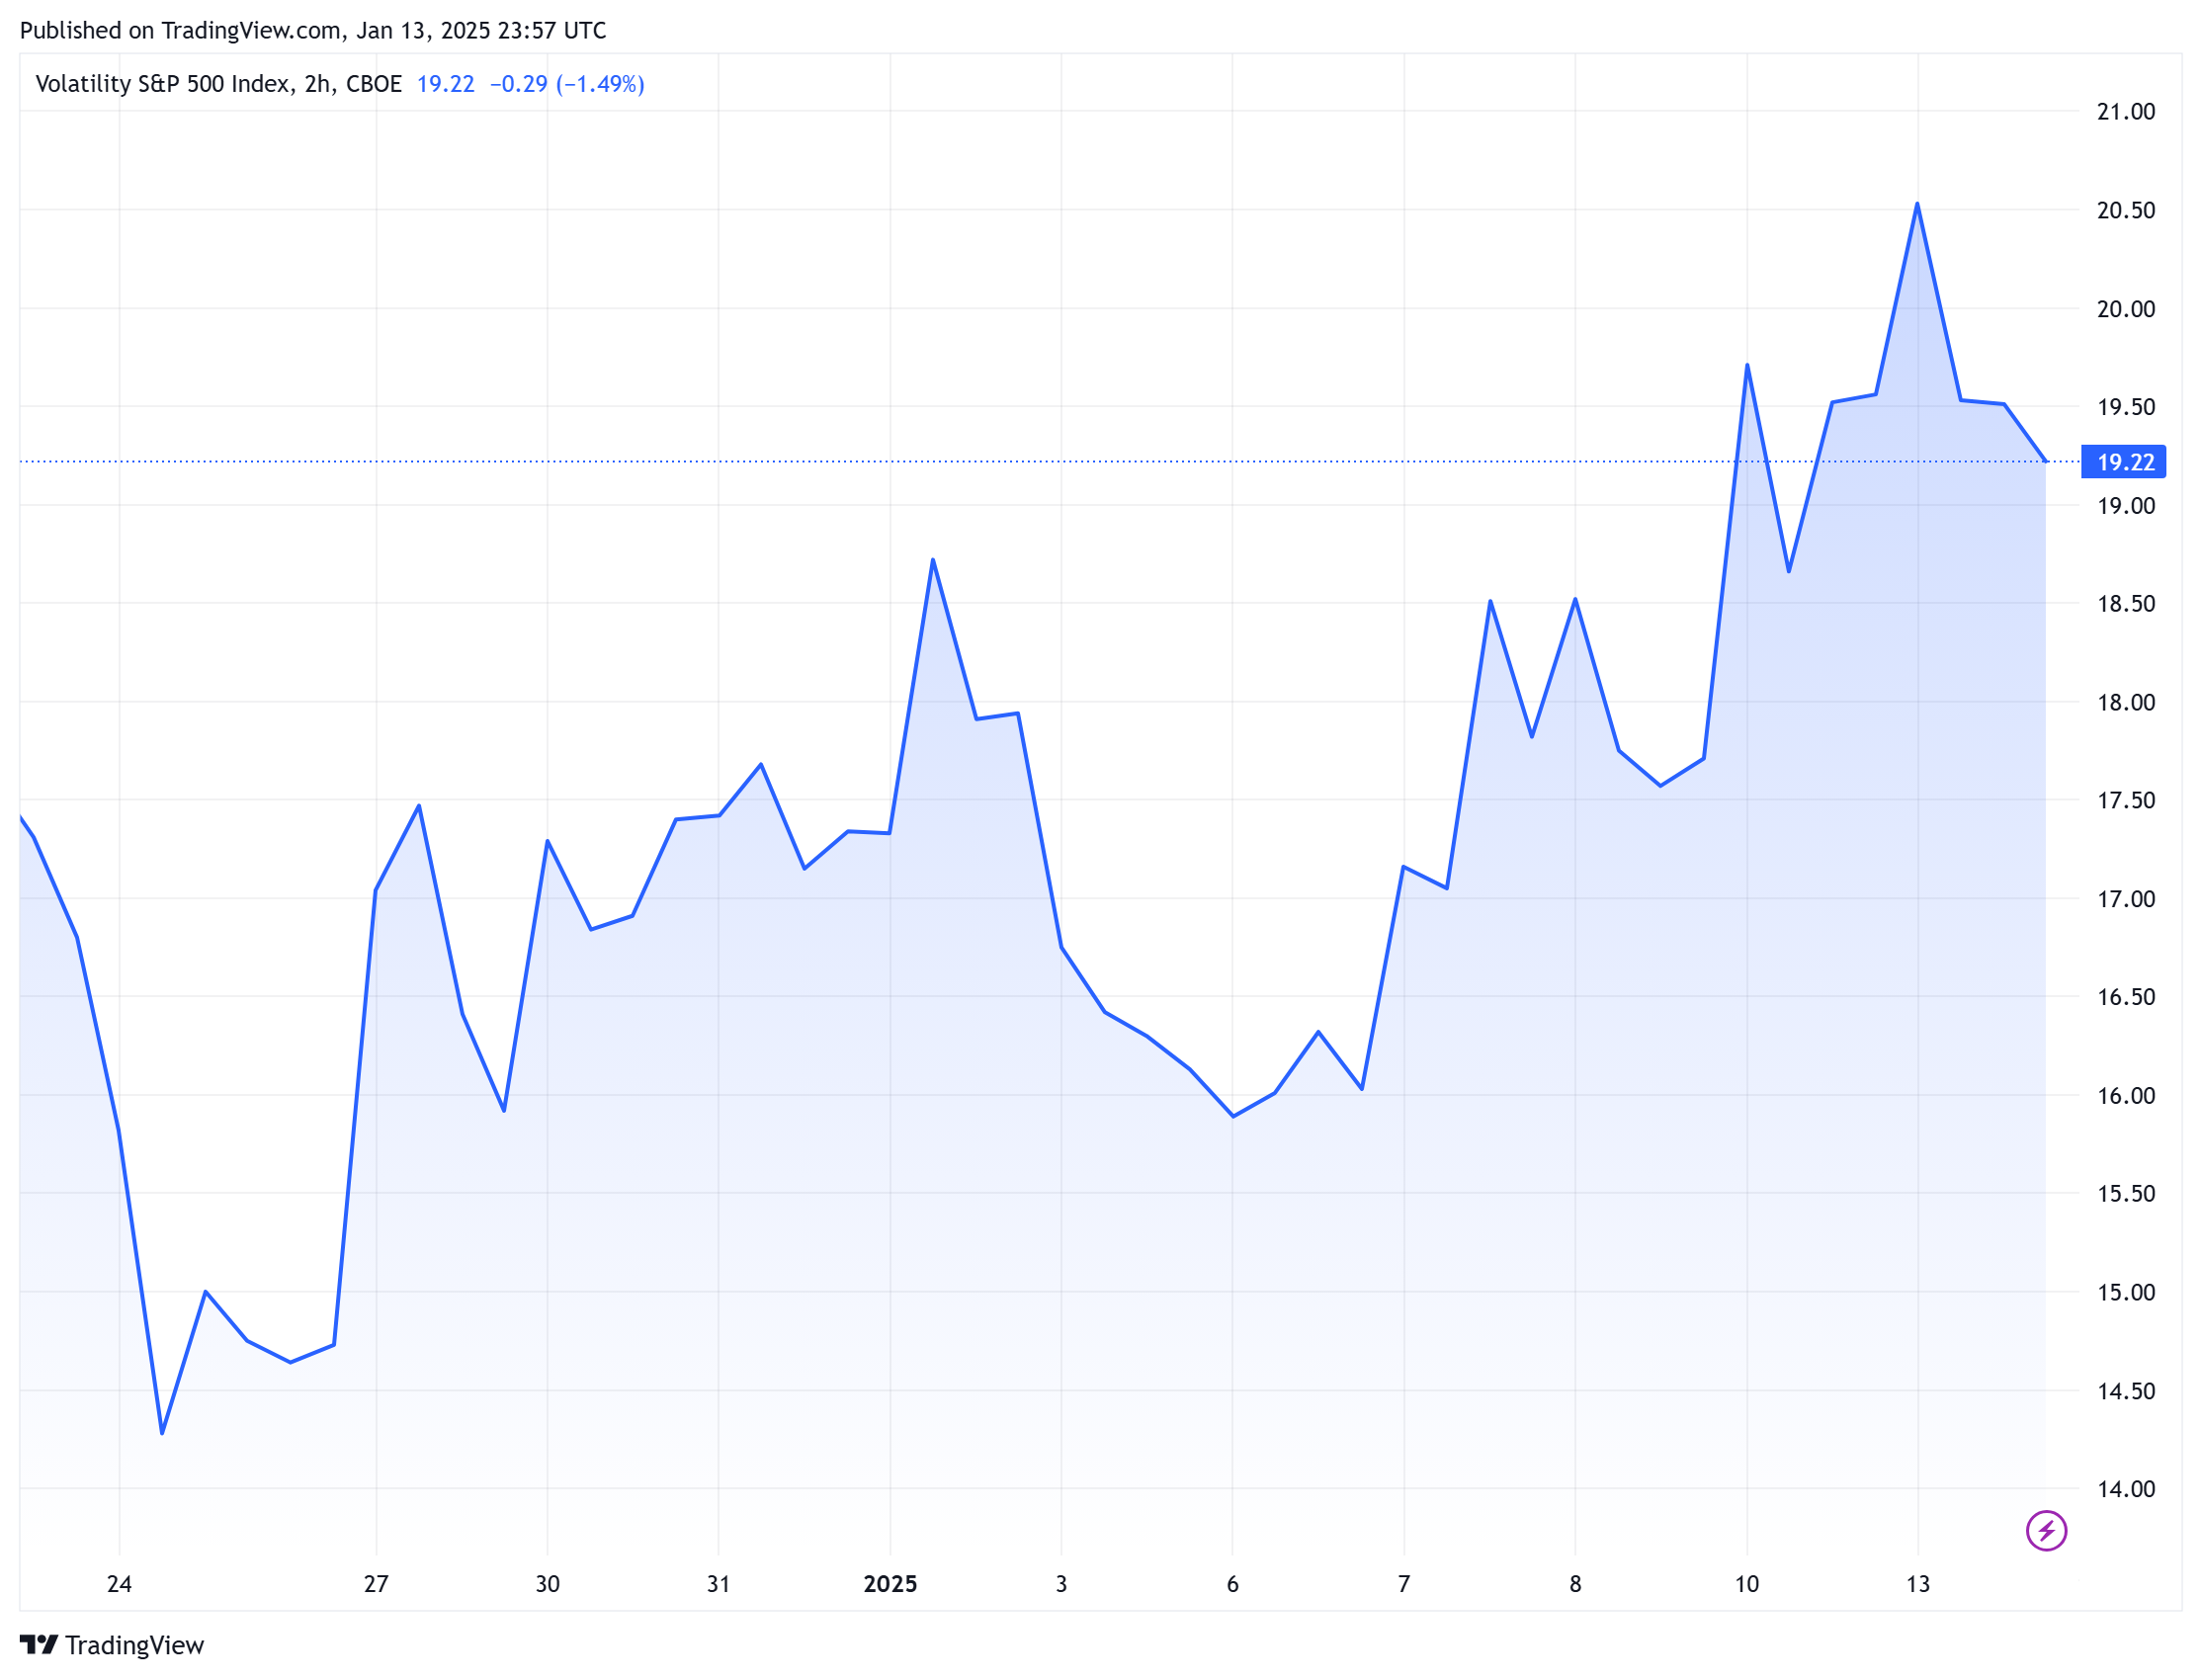
    Market Sentiment: Balancing Hope and Fear

    Market analysts describe the current environment as one driven by mixed signals. The optimism stemming from potential production increases and geopolitical stability is counterbalanced by lingering fears of reduced demand growth. Trump’s tariff threats against major trading partners, including Canada, Mexico, and the European Union, add another layer of complexity, creating an atmosphere of cautious pessimism.

    For traders, the near-term outlook remains challenging. Price volatility is expected to persist, with a potential dip to $71 as the market seeks liquidity before finding support for an upward trend. Our analysis recommends a cautious approach, focusing on selling zones in the $76.20-$77.70 range.

    The Bigger Picture: Risks and Opportunities Ahead

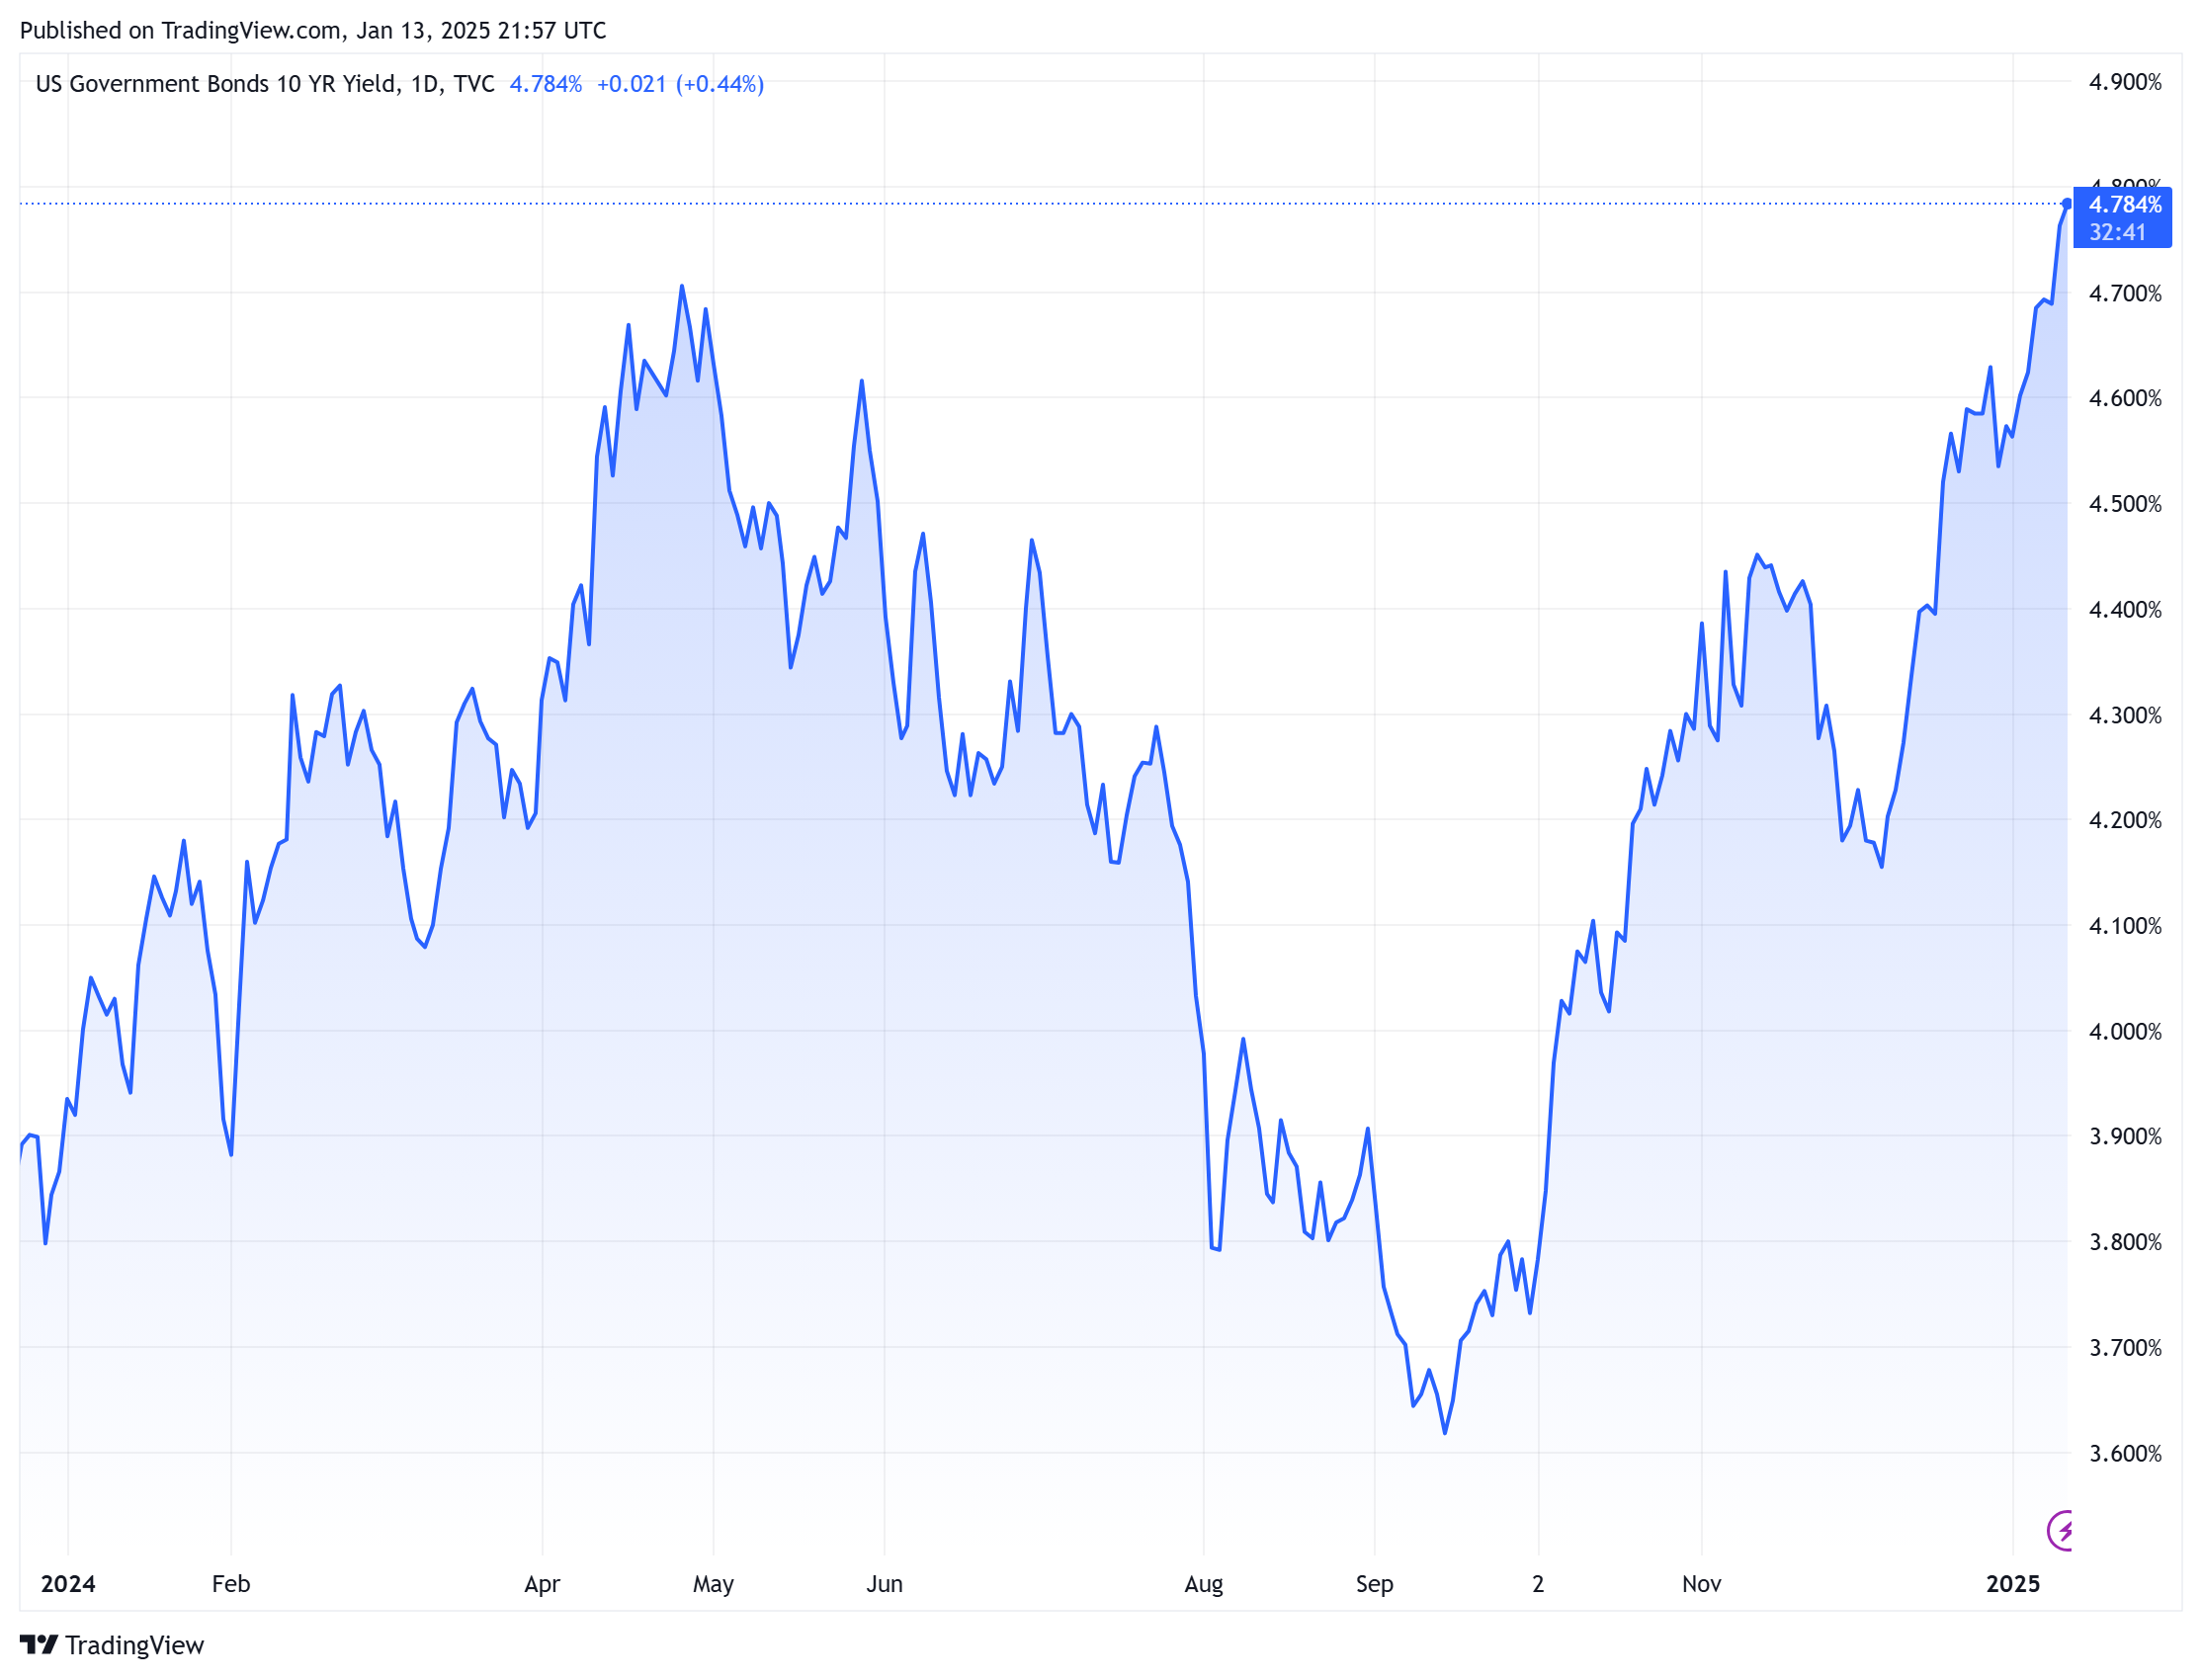
    As the oil market braces for more turbulence, the key risks revolve around U.S. trade policies and global economic uncertainty. Trump’s aggressive stance on tariffs, coupled with the possibility of further sanctions, introduces an unpredictable element to the equation. At the same time, increased U.S. production provides a buffer, offering hope for a more balanced market in the long run.

    The story of oil, as it unfolds in 2025, is one of resilience amidst adversity. With shifting policies and fluctuating prices, the market’s future hinges on the delicate interplay of domestic production, global demand, and the ever-present spectre of political intervention. For now, traders and analysts alike must navigate these complexities with caution, keeping an eye on both the risks and opportunities that lie ahead.


    US Oil Market Update Summary January 23rd

    Impact of Trump’s Tariffs on Oil Prices

      Domestic Impact: Proposed tariffs on Canada, Mexico, and other trade partners could increase U.S. gasoline prices by $0.25 to $0.75 per gallon due to retaliation and higher production costs. These policies create volatility in crude oil prices, affecting both supply and demand.

      Global Impact: Global oil prices, particularly WTI crude (currently around $75/barrel), are pressured by uncertainty about the tariffs, leading to potential supply disruptions and dampened demand growth.

      Current Price Trends

      • WTI Crude Oil: Trading around $75 per barrel as of January 23.
      • Key Levels:
        • Support: $70-$72 (areas of prior buying interest).
        • Resistance: $78-$80 (areas of selling pressure).
      • Technical Indicators:
        • Moving Averages: The “death cross” (50-day EMA below 200-day MA) suggests bearish sentiment.
        • Bollinger Bands: Price is above the middle band, showing potential short-term bullishness.
        • RSI: Around 54-59, indicating $75-$76 as a bounce zone.
        • MACD: Daily view remains bullish.

      Market Drivers

      • Mixed Market Factors:
        • Positive: Easing geopolitical risks in Gaza and potential U.S. production increases under pro-drilling policies.
        • Negative: Higher U.S. crude stocks and gasoline inventories, with stock levels rising as follows:
          • Crude: +958,000 barrels (week ended Jan 17).
          • Gasoline: +3.23 million barrels.
          • Distillates: +1.88 million barrels.
      • Uncertainty: Lack of clarity on Trump’s tariff policies and increased U.S. oil supplies could cause near-term volatility and downward price movements.

      Outlook

      Short-term bearish outlook remains dominant due to mixed technical and fundamental factors. Prices may drop to $71 to seek liquidity before resuming an upward trend. Selling zones are identified at $76.20-$77.70.

      Key Risks

        Ongoing trade uncertainties from Trump’s policies, potential new tariffs, and global economic slowdowns could weigh heavily on oil market stability.

        Thus, oil prices and market trends remain heavily influenced by U.S. trade policies, reflecting the ongoing bearish sentiment in the market.


        Best investment strategies during volatility Bitcoin Drops Below $100K Bitcoin Profit-Taking and Liquidations brent oil Central Bank Rate Decisions CL_F Commodity Market Analysis January 2025 CPI data crude oil day trading DeepSeek AI Market Impact Dollar strength DXY Eurozone and U.S. Treasury Yields FED Financial Market Analysis Earnings Reports 2025 Tech Stocks Performance Forex analysis geo-politics Global Market Trends 2025 GOLD Gold and Oil Price Trends How tariffs affect the stock market macro market newsletter macro markets macro report macro trading market analysis market volatility OPEC Safe-haven assets during market downturns technical analysis Tech Stock Selloff January 27th Tech stocks to watch after earnings trading strategies treasury yields Trump tariffs U.S. Dollar Weakness UK Gilts USDJPY US inflation US Oil USOIL VIX WTI XTIUSD

      1. Short-Term Energy Outlook, January 2025

        Short-Term Energy Outlook, January 2025

        The following is a brief summary and takeaway of the EIA (Energy Information Administration) Short-Term Energy Outlook (STEO) January publication.

        Outlook for Oil Prices:

        • Near-term (2025): Prices may remain stable or decline slightly after Q1 2025 due to stock builds and slower demand growth.
        • Mid-term (2026): Brent oil prices are forecasted to drop significantly, driven by oversupply and reduced growth in global demand, especially from OECD countries.
        WTI crude oil price

        Reasons for OPEC Actions:

        • Stabilizing market share: OPEC+ is increasing output incrementally to meet anticipated demand growth while maintaining influence over prices.
        • Balancing commitments and capacity: Despite higher output, production will likely fall short of announced targets due to internal constraints and deliberate measures to prevent excessive price declines.
        • Strategic responses to competition: OPEC’s actions reflect an effort to remain competitive against non-OPEC producers like Brazil, Canada, and Guyana, which are contributing significantly to global supply growth.
        OPEC+ Crude Oil Production

        Takeaway:

        • Global oil production is projected to grow moderately: OPEC+ production is expected to rise annually, though not to the full extent of announced targets. Non-OPEC+ nations will also see steady increases, driven by Brazil, Canada, and Guyana.
        • Market balance pressures: While output grows, Brent oil prices are expected to drop after Q1 2025 due to stock builds and reduced OECD demand growth in 2026.
        • US oil output nearing a plateau: Growth in tight oil regions like the Permian Basin is barely offsetting declines elsewhere, leading to marginal increases by 2026.
        World liquid fuels production & consumption balance
      2. US Oil Short Trade Update Jan 21st

        US Oil Short Trade Update Jan 21st

        We have just exited all shorts from the $79 region as price takes a breather and bounces off near term support at $75.10. As stated in prior posts, price breezed through our initial target of $76. Currently seeking further short entries around $77 – near term support turned resistance. Please adjust price levels for your broker accordingly.

        We’ll see what price does at this point. The near term bearish case still holds, and we still see price targeting the $71 zone. However, with increased volatility, we stay vigilant and so cannot rule out a quick rip to the $79 region.

      3. US OIL Update January 15th, 2025

        US OIL Update January 15th, 2025

        With today’s Core CPI printing at 0.2%, cooler than expected, markets may interpret this as the FED pausing rate hikes for now. However, is this enough to dampen the prevailing narrative and curb discussions of further rate increases? While it doesn’t provide a clear green light for a “risk-on” environment, markets reacted positively. Stocks soared, and banks reported strong earnings.

        US oil prices followed suit, with the weekly downtrend channel resistance currently being tested. Near-term factors, as outlined in our Alpha Edge Report (Jan 13), continue to support the daily bullish case. Notably, oil remains within a monthly consolidation triangle, with key support at $66. Both the monthly and weekly RSI momentum indicators are bullish. Price has already closed above the daily resistance level of $78 on the 4H chart. A daily close above this level would shift the focus to the next target of $80. We remain bullish on oil in both the near and mid-term outlooks.

        Trading Strategy

        Ideally, we would prefer a retracement to the low $75 range, as entering long positions from $76–$78 offers limited value. Having exited our previous long trade from $68 to $75, we remain sidelined for now. Our next entry will be contingent on a strong bullish daily close above $79.24.

        Key levels to watch:

        For bulls: $80, $84, $85, and $88.

        For bears: $76 and further down to $71.

      4. Market Volatility Increases Pre Inflation Data

        Market Volatility Increases Pre Inflation Data

        A Market on Edge

        Following the Non-Farm Payrolls (NFP) report on January 10, 2025, financial market sentiment has shifted notably. U.S. Treasury yields surged as investors reacted to stronger-than-expected job growth, raising concerns about persistent inflation and the Federal Reserve’s interest rate policies. In the UK, investor sentiment turned negative due to rising gilt yields linked to specific fiscal challenges and inflationary pressures from recent budget measures. Overall, markets are bracing for potential volatility as economic data influences central bank strategies amid a backdrop of heightened uncertainty.

        Post-NFPs on January 10, 2025, the stock market reacted negatively despite positive job growth data. Investors reassessed the likelihood of central bank rate cuts, leading to higher government bond yields, particularly affecting high-valuation sectors like technology. The Nasdaq fell by 2.3%, while defensive sectors like utilities performed better. Overall, the Dow Jones and S&P 500 also declined by 1.9% each, reflecting a cautious outlook as markets adjusted to the implications of the labor report on monetary policy expectations.

        As of January 13, 2025, the CBOE Volatility Index (VIX) is at 19.54, having increased by 8.1% from the previous day. This rise indicates heightened market volatility expectations, often referred to as the “fear gauge.” A VIX level above 20 typically suggests increased uncertainty among investors regarding future market movements. Therefore, the current VIX reading indicates a notable level of anticipated volatility in the market today.

        Sector Spotlight: Oil, Gold, and Crypto

        After the January 10th Non-Farm Payrolls (NFP) report, which indicated a stronger-than-expected job growth of 256,000, sectors like oil, gold, and crypto experienced notable movements:

        • Oil: Prices surged, reaching four-month highs due to increased demand and inflation concerns. Some market commentators noted that this positive trend was supported by expectations of economic growth in China and rising winter fuel demand. However, US pressure on Iran remains a dominant narrative, translating to a near-term bullish case for oil.
        • Gold: The performance of gold remained buoyant but contained within its weekly consolidation triangle, acting as a weak hedge against oil market fluctuations.
        • Crypto (Bitcoin): We continue to see Bitcoin as a risk asset rather than a safe haven. Thursday’s sell-off and muted bounce post-NFP kept Bitcoin within its weekly consolidation range of 91,000 – 104,000.

        Forex Performance: A Dollar Surge

        Following the January 10th NFP report, the forex markets reacted significantly:

        • US Dollar (DXY): The DXY surged to its highest level since November 2022, nearing 110.00, driven by strong job growth and reduced expectations for Fed rate cuts in 2025.
        • EUR/USD: The euro weakened against the dollar, approaching multi-year lows and parity as the dollar’s strength overshadowed any positive domestic data from Europe.
        • USD/JPY: The USD/JPY pair saw modest gains, reflecting expectations of potential policy shifts from the Bank of Japan due to strong US labor market data.

        Looking Ahead: CPI Inflation Data

        Analysts are cautiously optimistic about market performance in the coming days, particularly with the upcoming CPI inflation data. Expectations are for modest inflation, with forecasts suggesting a CPI of around 2.4% for 2025, down from 2.9% in 2024.

        The strong labor market could bolster the US dollar further, impacting forex rates like EUR/USD and USD/JPY negatively. In the stock market, analysts predict continued gains but at a slower pace than in 2024, with a projected S&P 500 target of 6,500, reflecting a roughly 9% increase. However, potential inflationary pressures from incoming policies could introduce volatility.

        Trading Strategies

        Indices

        • SPX Weekly up-trend still intact. Price is currently at dynamic support with the 25 EMA and mid Bollinger Band circa 5827. If the CPI print comes in unfavourably, we see price targeting support around 5650 just off the 50 EMA. Near term BEARISH. Long term BULLISH.
        • NASDAQ Long term up trend intact as long as we remain above 18000. As last week’s market moves continue we see price holding at dynamic support around 26800 — 50 EMA and mid Bollinger Band. However divergence on the weekly RSI is more prominent. Underlining the near term bearish case as momentum fades. Near term BEARISH. Long term BULLISH.

        Commodities

        • US OIL Weekly down trend intact. But previously mentioned near term factors maintain the daily bullish case. Note OIL is still contained within a monthly consolidation triangle with support at 66. Monthly and weekly RSI momentum is bullish. Price has already closed above daily resistance at 78 on the 4H chart. A daily close above this level brings the next target of 80 in focus. We remain BULLISH on OIL near term and mid term.
        • Gold: As already mentioned, GOLD’s performance remains buoyant, but contained within its weekly consolidation triangle. Near term support is 2600 and resistance at 2730. Price is at multi-year highs we see it remaining BULLISH long term with continued market uncertainty and volatility. Near term RANGE BOUND as price navigates this weekly consolidation.
        • Crypto (Bitcoin): Again, Thursday’s sell off and muted bounce post NFPs, kept BItcoin within its weekly consolidation range of 91,000 – 104,000. We have been monitoring this consolidation pattern in BTC and altcoins since mid-December. Failure to maintain 104,000 and strong RSI divergence have kept us bearish. Next targets for BTC is 80,000. Above the last consolidation and dynamic supports 50 EMA and mid Bollinger. Near term BEARISH. Long term BULLISH.

        Forex

        • US Dollar (DXY): Dollar holla. As noted in our post NFP summary above, USD remains strong across the board. Price and RSI momentum are bullish on all charts including weekly and monthly with healthy pullbacks. Price is on course for all time highs at 114. Near term BULLISH. Long Term BULLISH.
        • EUR/USD: Again multi-year lows and parity in sight with USD strength. Near term BEARISH. Long term BEARISH.
        • USD/JPY: The pair is at multi-year highs and the only negative we see is possible near term consolidation as price looks to attack at high 161s. Weekly range. Support 140.50 to 160 resistance. So as RSI momentum drops, buy any dips. Near term RANGE. Long term BULLISH.
      5. Market Caution Amid Tech Selloff, Inflation Fears & Oil Volatility January 8, 2025

        Market Caution Amid Tech Selloff, Inflation Fears & Oil Volatility January 8, 2025

        Market Pulse: Navigating the Turbulence of January 8, 2025

        As the financial markets kicked off the second week of 2025, the mood among investors could best be described as cautious. The year had barely begun, yet volatility seemed to have already made itself at home. The source of the jitters? A sharp selloff in the tech sector, lingering inflation fears, and rising Treasury yields.

        On this particular day, futures for the Dow Jones and S&P 500 edged lower, reflecting investor anxiety. With the Federal Reserve signaling a 95% likelihood of maintaining its current rate policies, hopes for a near-term pivot were all but extinguished. Treasury yields, climbing past 4.7%, underscored persistent inflation concerns and left traders bracing for another rocky session. Adding to the suspense, critical job market reports and the release of Federal Reserve meeting minutes were on the day’s agenda.

        Tech Takes a Hit

        The tech-heavy Nasdaq bore the brunt of investor unease on January 7. A strong ISM services index reading hinted at continued economic expansion and, alarmingly, rising prices. For inflation-wary investors, this spelled trouble. Concerns swirled that the Federal Reserve might maintain its hawkish stance on interest rates, keeping borrowing costs elevated and dampening growth.

        Big names in tech took a beating. Nvidia plummeted 6.2%, while Tesla slid 4%. These declines dragged the Nasdaq down nearly 2%, sending ripples across the broader market. The selloff served as a stark reminder that even giants are not immune to the broader economic narrative.

        Commodities Hold Their Ground

        While the tech sector stumbled, commodities painted a more nuanced picture.

        Oil: Early in the week, crude prices enjoyed a modest rally, buoyed by optimism surrounding economic recovery in the U.S. and China. Brent crude reached $75.48 per barrel, and WTI climbed to $72.44. Supply constraints from OPEC and weather disruptions in key production regions lent additional support. But the tide turned on January 7. A strengthening U.S. dollar, coupled with concerns about oversupply from non-OPEC producers, reversed earlier gains. Bearish inventory data added fuel to the fire, sending crude prices lower.

        Metals: Gold shone brightly amid the uncertainty, with prices surging to $2,650 per ounce. The metal’s safe-haven appeal drew strong demand from investors seeking shelter from inflation and economic volatility. Copper and aluminum held steady, supported by favorable financing conditions for gold-related projects.

        Cryptocurrency: Despite some volatility, the crypto market proved its resilience, delivering a generally positive performance. Bitcoin and Ethereum led the charge, buoyed by expectations of lower interest rates and optimism around Bitcoin ETFs. Whilst some may view this asset class as an inflation hedge, we still view the sector as highly speculative.

        What’s Driving Oil Prices?

        The rise and fall of oil prices during this period illustrate how complex and interconnected the energy market can be. Early optimism was driven by strong economic data from the U.S. and China, which suggested higher energy demand as their economies recovered. OPEC’s production cuts further tightened supply, while geopolitical tensions and weather-related disruptions added risk premiums to prices.

        Yet, the market’s mood shifted as quickly as a change in the wind. On January 7, oil prices stumbled in response to a stronger U.S. dollar and concerns over rising supply. Reports of increased production from the U.S. and other non-OPEC countries introduced the specter of oversupply, while weaker economic data from Germany hinted at slower demand growth. By the end of the day, the once-promising rally had turned into a selloff.

        The Road Ahead

        Looking forward, analysts are sounding a note of caution. While U.S. equities have shown resilience in the face of elevated valuations, the road ahead is far from smooth. Inflation remains a pressing concern, and any hints of further rate hikes from the Federal Reserve could unsettle markets.

        Sectoral dispersion will likely define the coming days, with some areas offering opportunities while others falter. Technology, in particular, will remain a focal point, as investors weigh the sector’s growth potential against the broader economic backdrop.

        For commodities, the balance between supply constraints and demand optimism will continue to shape the narrative. Meanwhile, cryptocurrency traders will keep a close eye on regulatory developments and market sentiment, hoping for another leg up in this volatile space.

        In a market defined by uncertainty, staying informed and adaptable is more important than ever. As the trading year unfolds, one thing is clear: 2025 is shaping up to be anything but predictable.

        To navigate these unpredictable waters effectively, make sure you’re equipped with the latest insights and analysis. Subscribe to our blog today for expert commentary, market updates, and strategies that can help you stay ahead of the curve. Don’t miss out on valuable information that could make all the difference in your trading and journey!

        Visit our Instagram for the audio summary.