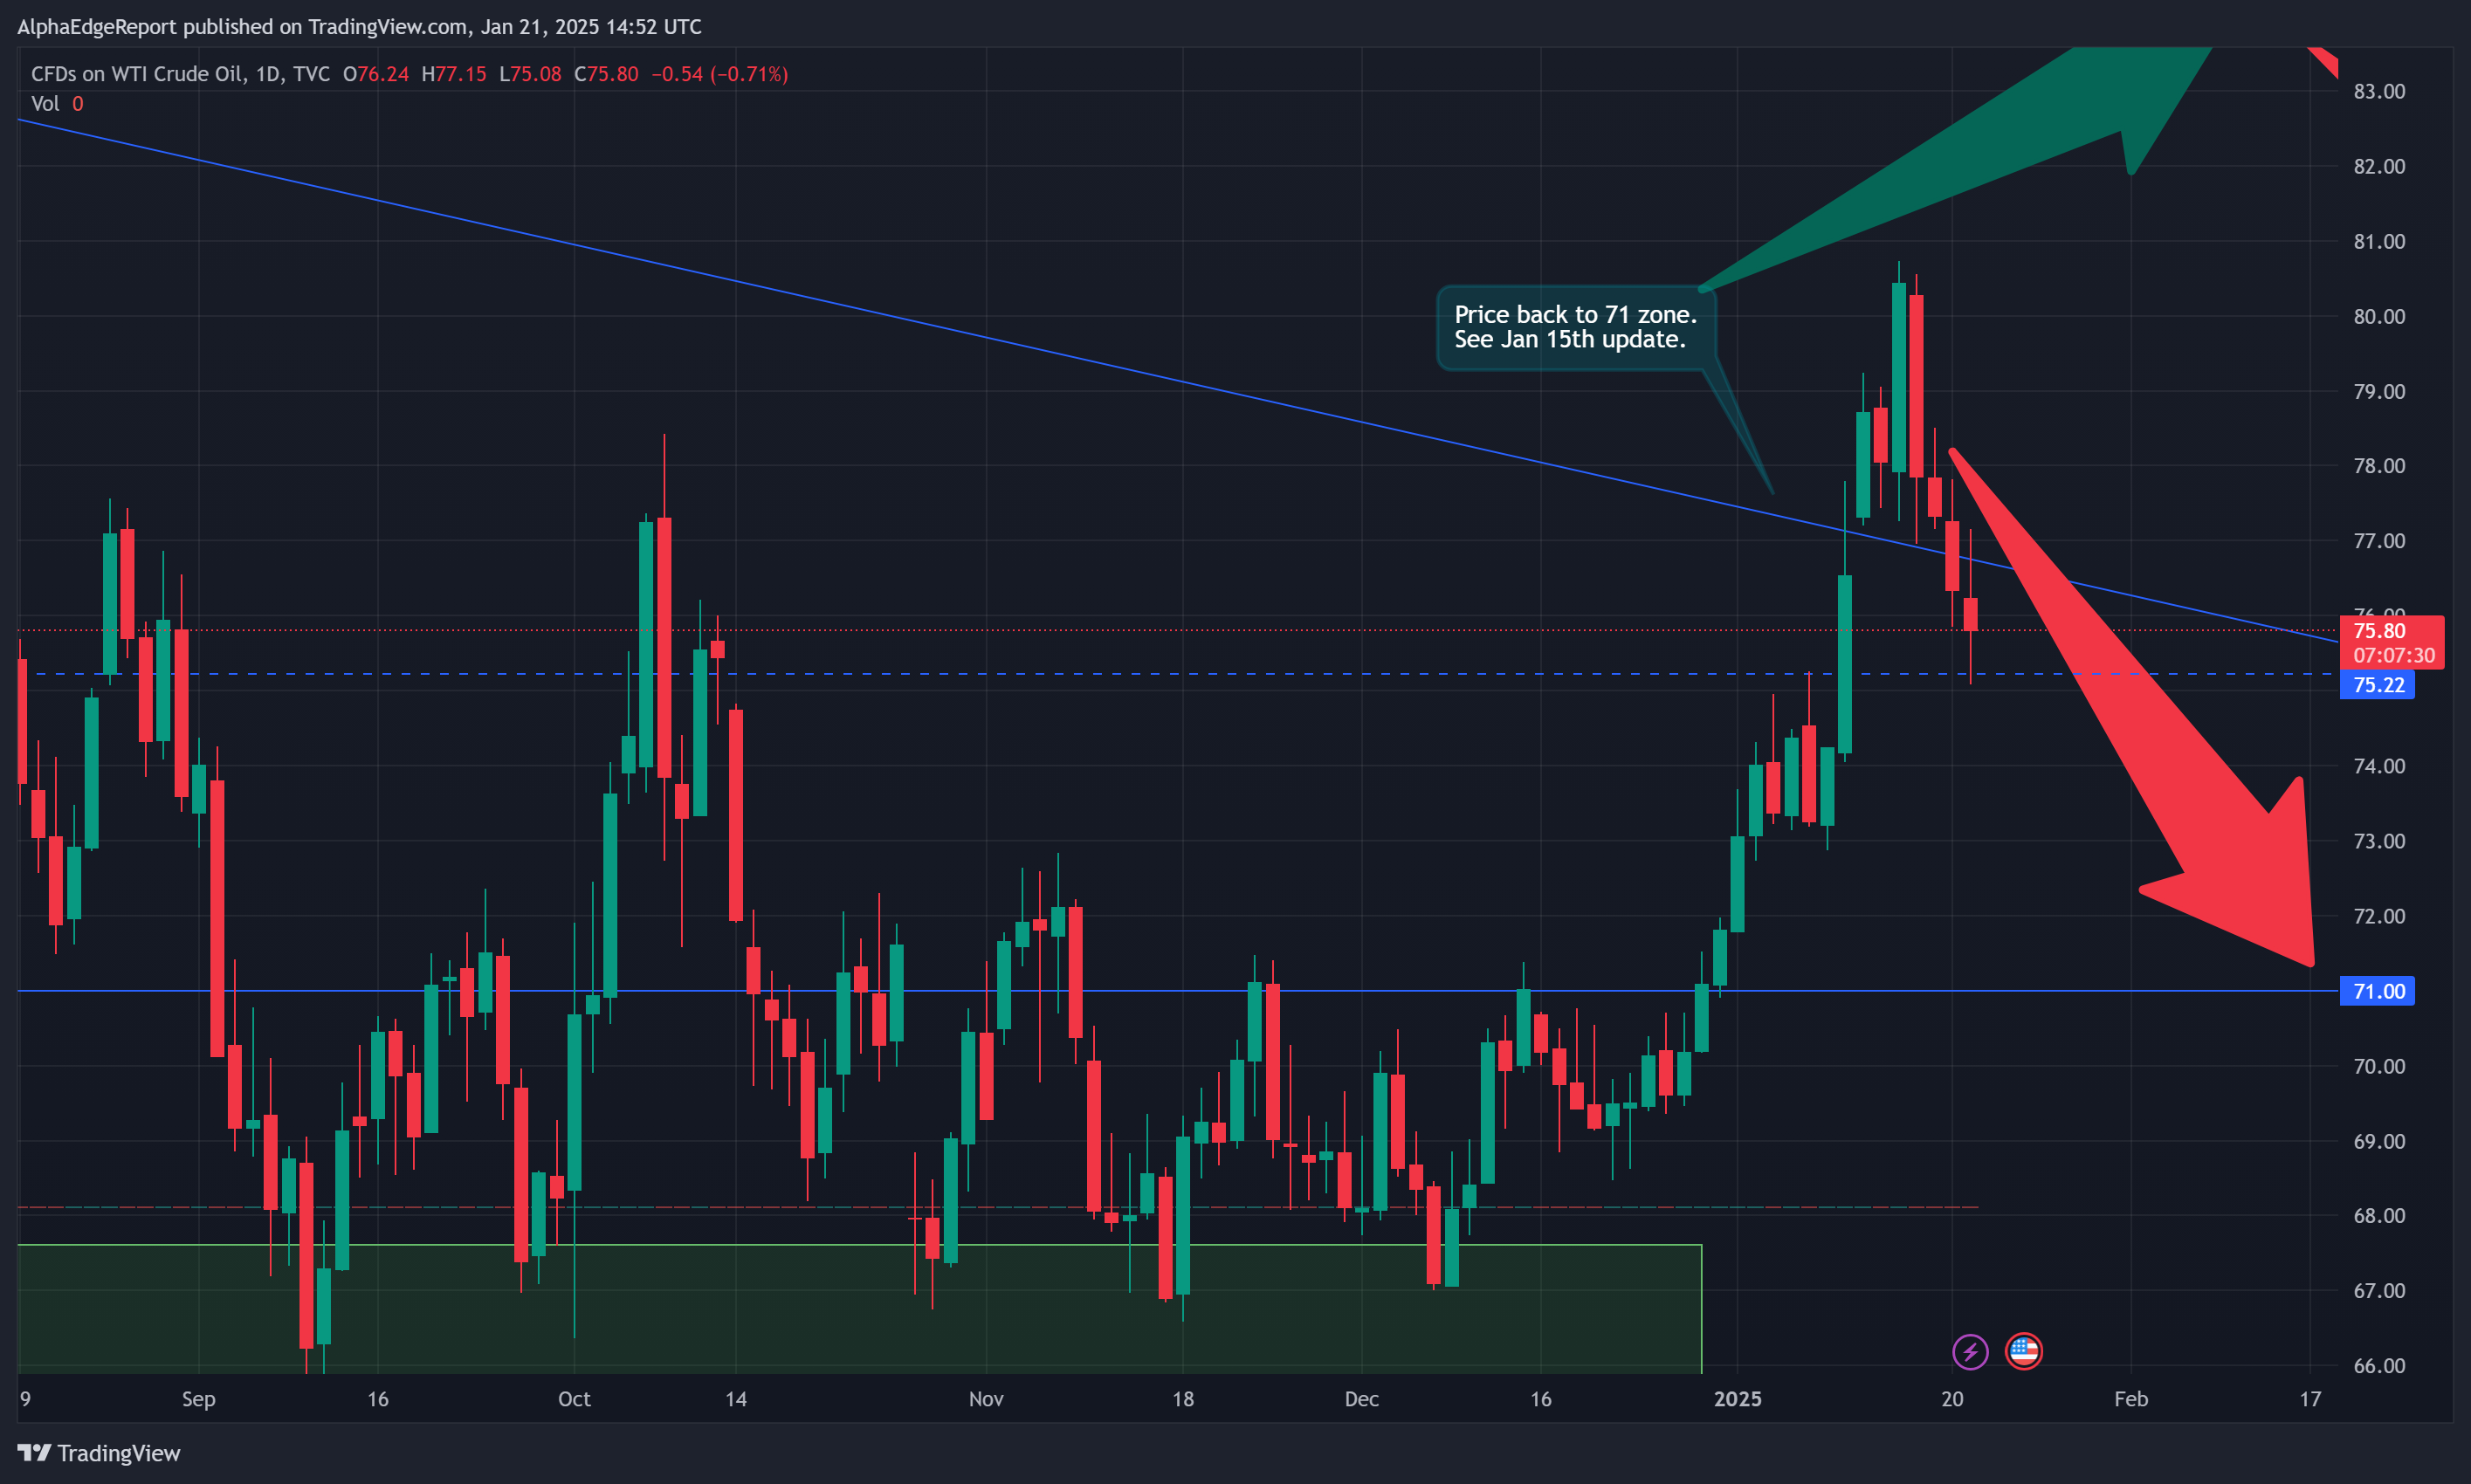
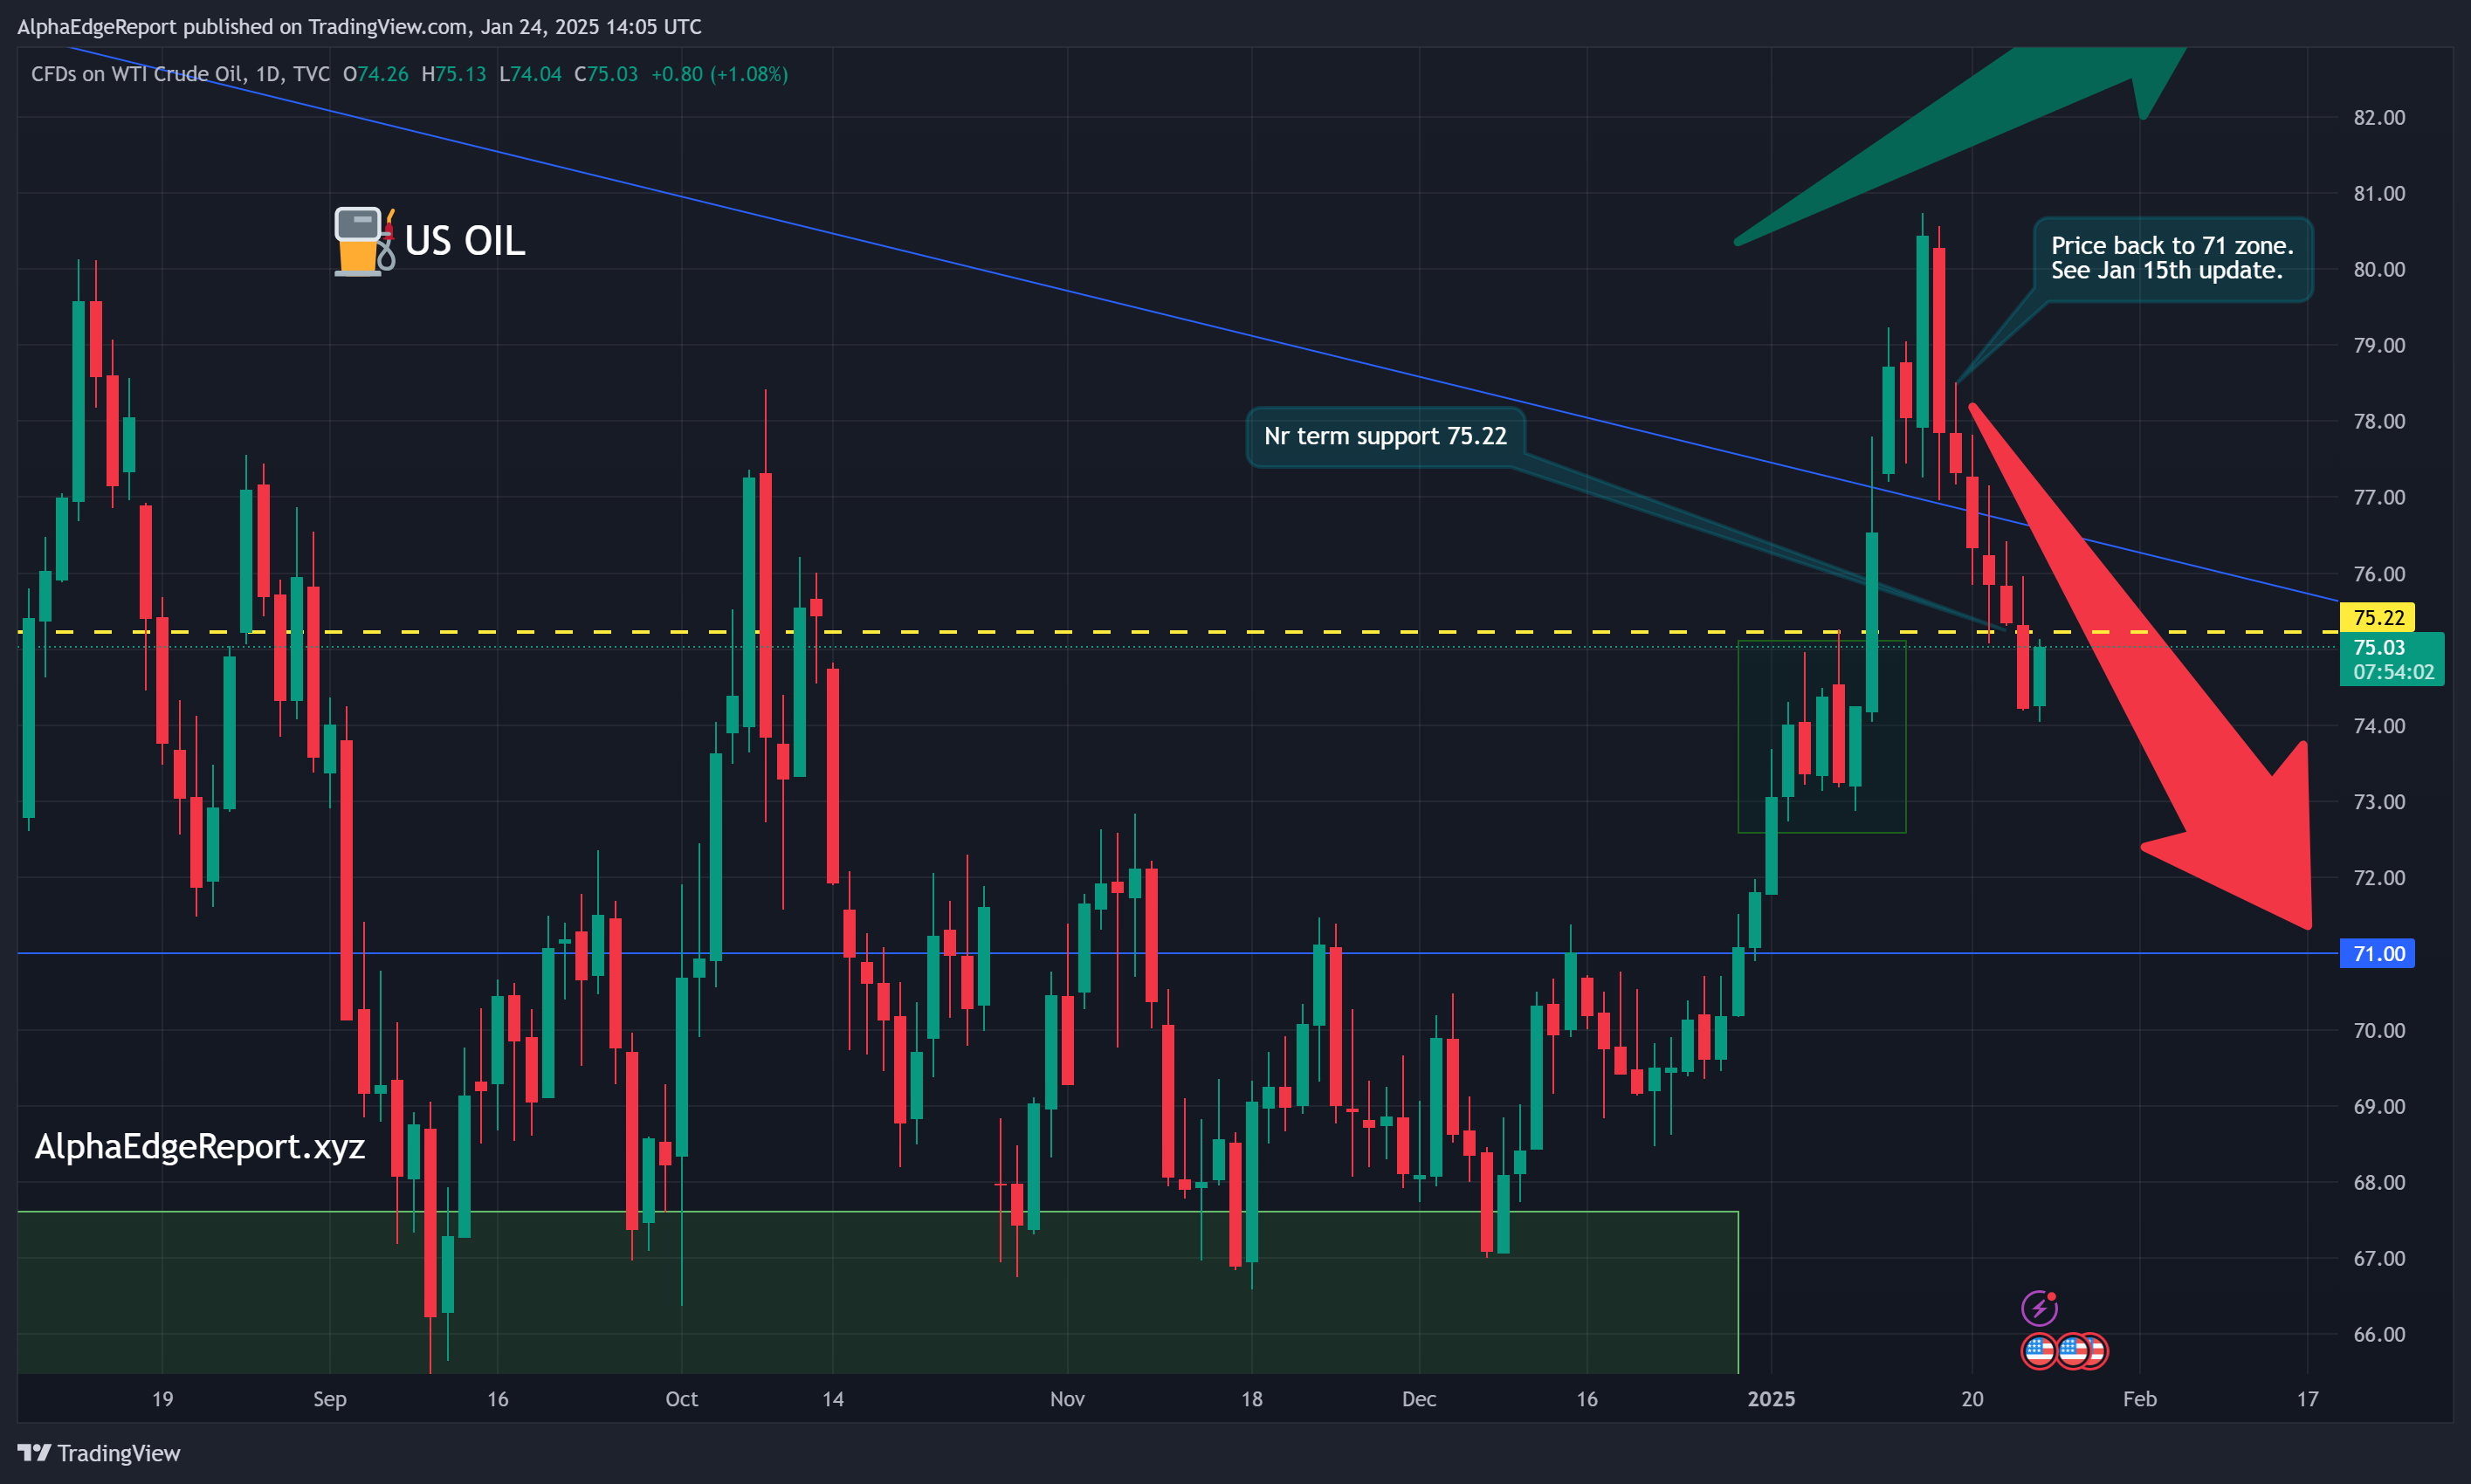
US Oil has broken our near term support at $75.22 (yellow line), and looks to be breaking down to the $71 price zone as outlined in previous reports. Its hard to see this as a pullback in a bullish daily trend. Beyond any fundamental catalyst, we don’t see any case for price to regain the $81 area just now. Indicators aside, both 4-hour and weekly charts are unambiguously bearish.
Its Friday and so we are sidelined until after the weekend.
Stay sharp and good luck with your trading.
Bitcoin breaks $100K brent oil BTCUSD ceasefire CL_F CPI data crude oil Cryptocurrency market performance day trading Dollar strength DXY FED Forex analysis Forex market analysis geo-politics GOLD Gold price surge January 2025 Inflation impact on markets Israel-Hamas macro investing macro market newsletter macro markets macro report macro trading market analysis Market trends January 2025 market volatility Middle East Oil price volatility OPEC technical analysis trading strategies treasury yields Trump tariffs U.S. stock market rally UK Gilts USDJPY US inflation US Oil USOIL VIX Weekly market recap WTI XAUUSD XTIUSD