
Hours away from Fed Powell’s Jack Hole address here’s a technical look at US OIL price action.
US Oil has recently shown an interesting technical setup that traders should watch closely. After bouncing off weekly lows, the price appears to be rallying on the 4-hour chart but faces notable resistance. Here’s a detailed look at the current market conditions, technical indicators, and key support and resistance levels.
Price Action and Volatility
The bounce off the weekly lows indicates a solid support zone around $55.10 where buying interest has stepped in. On the 4-hour chart, US Oil is currently trading near the upper Bollinger Band, which often acts as a dynamic resistance line. This positioning suggests that the short-term rally might face hurdles or a possible pause.
The candlestick pattern on this timeframe shows higher highs and lower lows, highlighting increased volatility and market indecision. This creates a tug-of-war between buyers and sellers, and traders should be alert for a decisive breakout or breakdown to confirm the next directional move.
Momentum Indicators
The 4-hour RSI at 64 is signalling moderately strong bullish momentum without reaching the overbought threshold (typically above 70). This suggests there is still some room for upside before a potential exhaustion of the current rally.
Supporting this view, the MACD is positive with a signal line at 0.1465 and a MACD histogram reading of 0.2541, reflecting underlying bullish momentum on the 4-hour chart. These momentum indicators lend credence to the ongoing mini rally despite some evident resistance.
Ichimoku Cloud Analysis
However, the Ichimoku indicator adds complexity to the picture. Price is currently positioned in the upper half of a bearish cloud, which typically implies that the overarching trend retains bearish elements and overhead resistance is significant.
The Chikou Span is trading above the current price but still below the cloud, indicating that while recent price action has been bullish, the overall medium-term context remains cautious. This highlights a fight between bullish enthusiasm and bearish control.
Key Support and Resistance Levels
Traders should take note of critical price levels:
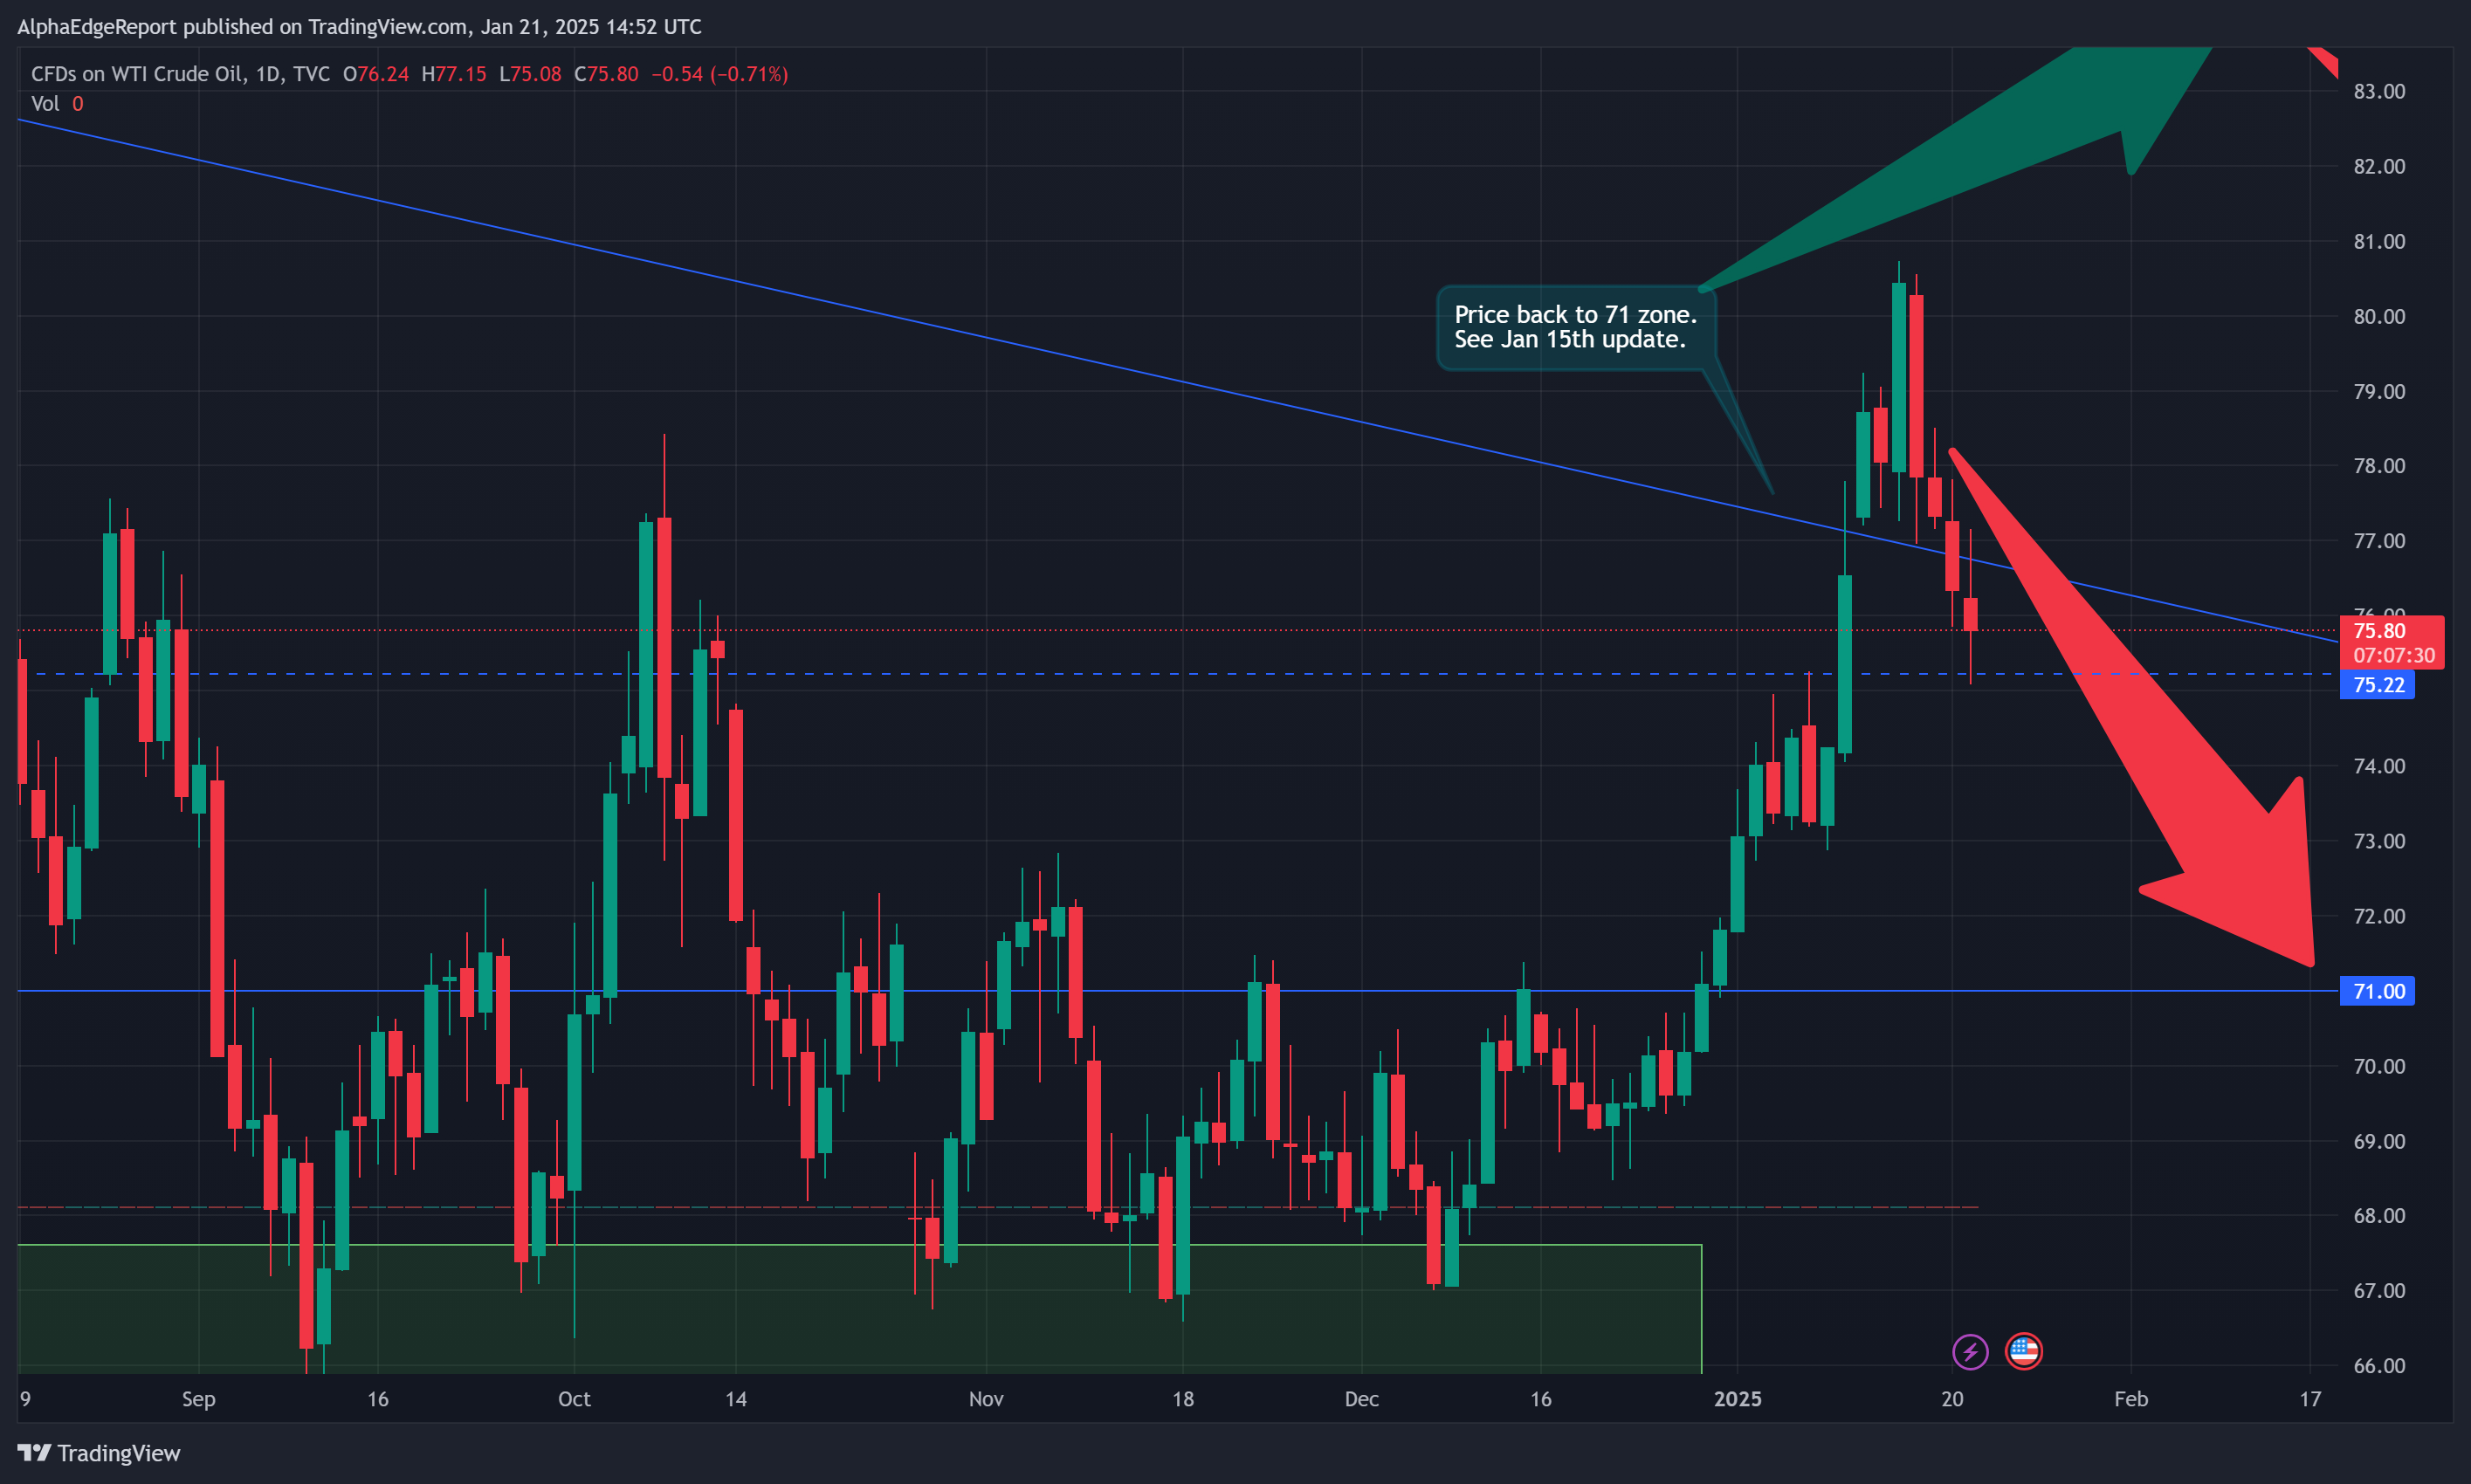
- Support: Around $55.109, the weekly low and recent bounce zone from April.
- Resistance: At approximately $65.30, not far above the top of the bearish Ichimoku cloud and recent price highs.
- Intraday support: Near $62.40, a level that could provide intermediate strength in corrections.
Conclusion
US Oil sits at an important technical crossroads. Momentum indicators hint at bullish continuation potential, but the presence of the bearish cloud and proximity to upper Bollinger Bands suggest resistance and possible pullbacks. A confirmed breakout above the cloud and recent highs would be a bullish signal worth following, while rejection could lead to consolidation or retracement.
Given the current volatility and indecision reflected in candle patterns, traders are advised to manage risk carefully and wait for clear confirmation signals before positioning.