Tag: market analysis

  • Bitcoin at the Crossroads: Navigating Opportunity and Risk Amid Macro Shifts

    Bitcoin at the Crossroads: Navigating Opportunity and Risk Amid Macro Shifts

    By AlphaEdge Macro Research | July 2025

    The Liquidity-Driven Market

    As Bitcoin consolidates near the $100,000 psychological threshold, a striking consensus emerges from leading analysts: digital gold’s price action has become untethered from its halving cycle origins and is now predominantly driven by global liquidity conditions. The correlation between Bitcoin’s year-over-year performance and changes in the M2 money supply has strengthened to near-parity, with 85% of BTC’s major price movements since 2020 occurring alongside shifts in central bank balance sheets.

    This liquidity dependence creates both opportunities and vulnerabilities. On-chain data reveals that long-term holders—typically the bedrock of market stability—have been unusually inactive during the current cycle. The percentage of Bitcoin supply dormant for over a year remains near record highs at 68%, suggesting neither the distribution patterns nor the euphoria typical of cycle peaks. Yet this stability faces mounting pressure from macroeconomic crosscurrents, particularly as the Federal Reserve grapples with what analysts are calling the “stagflation conundrum.”

    The Stagflation Catalyst

    Recent GDP contractions and resurgent inflation have forced market participants to confront an uncomfortable reality: the U.S. economy appears trapped in a policy vise. The probability of recession hitting 64% by May 2025—as tracked by prediction platform Kalshi—has created what some traders describe as a “perverse bullish case” for Bitcoin.

    “The Fed’s worst nightmare is playing out in real time,” notes one market strategist, pointing to the 0.3% GDP miss in Q1 2025 alongside sticky 4.2% core inflation. Fed funds futures now price in a 63% chance of rate cuts by June, with the market essentially betting that policymakers will prioritize fighting unemployment over price stability. This creates ideal conditions for what analysts term “liquidity escape velocity”—the point where fiat debasement fears overwhelm short-term risk aversion.

    Institutional behavior confirms this thesis. Bitcoin ETF inflows in December 2024 alone absorbed 3.7 times the network’s new coin production, while corporate treasuries added a record 59,700 BTC—equivalent to 4.3 months of mining output. The resulting supply squeeze has pushed the illiquid supply ratio to its highest level since the 2021 bull market.

    The Divergence Dilemma

    Beneath these bullish indicators lurks a concerning divergence. While on-chain fundamentals scream scarcity—exchange balances have plummeted to 2018 levels—macro headwinds are intensifying. The December 2024 FOMC meeting proved particularly damaging, as a hawkish 25 basis point cut (accompanied by upwardly revised “dot plot” projections) triggered the sharpest dollar rally in nine months.

    This created what market technicians call a “liquidity choke point.” The DXY dollar index’s 6% surge since the Fed meeting has contracted global money supply growth to just 1.2% annualized—below the threshold historically associated with Bitcoin bull markets. Perhaps most worryingly, Bitcoin’s 60-day correlation with the S&P 500 remains elevated at 0.75, leaving it vulnerable to any repricing of growth assets.

    The $200,000 Question

    Against this backdrop, analysts are parsing two competing narratives:

    1. The Deficit Doom Loop: With U.S. debt service costs now consuming 42% of tax revenues and demographic pressures accelerating, fiscal dominance appears inevitable. “You can’t taper a Ponzi,” quips one analyst, noting that even 2% Treasury yields would add $400 billion annually to deficits. This structural backdrop favors hard assets, with several models suggesting Bitcoin’s market cap could capture 5-10% of global “scarcity premium” flows within five years.
    2. The Liquidity Trap: Should the Fed delay cuts amid stagflation, Bitcoin could face a replay of 2022’s deflationary collapse. Technical analysts flag the $82,000 level as critical support—a breach there would invalidate several cycle progression models.

    Market participants appear to be hedging both scenarios. Options open interest shows growing demand for $200,000 December 2025 calls, while the put/call ratio has quietly reached its most defensive level since the COVID crash. This bifurcation reflects what one trader describes as “the ultimate volatility setup”—a market pricing in both monetary catastrophe and policy salvation simultaneously.

    The New Cycle Playbook

    What emerges is a portrait of Bitcoin’s maturation. The asset still responds to macro shocks, but with diminishing beta to risk assets and growing sensitivity to monetary policy errors. The four-year cycle hasn’t disappeared so much as evolved—today’s bull runs are less about retail mania than institutional accumulation against a backdrop of fiscal deterioration.

    For investors, this suggests a strategy shift: rather than timing halvings, the new playbook involves monitoring liquidity indicators (global M2, reverse repo balances) and institutional flow patterns. As one report concludes: “When the Treasury market sneezes, Bitcoin catches a cold—but when the dollar system fever breaks, it may be the only asset left standing.”

    The coming months will test whether Bitcoin can maintain its precarious balance between macro casualty and monetary lifeboat. With $6.2 trillion in global negative-yielding debt and central banks facing their greatest credibility crisis since the 1970s, the stage is set for either Bitcoin’s validation as a hedge asset—or its most brutal efficiency test yet.

    Sources:

    • Lyn Alden’s “Bitcoin Market Outlook and Macro Insights”
    • Cointelegraph’s “Bitcoin Eyes Gains as Macro Data Makes US Recession Base Case” (May 2025)
    • Bitwise’s “Balancing On-Chain Tailwinds With Macro Headwinds” (January 2025)
    • CME FedWatch Tool, The Kobeissi Letter, NilssonHedge, Truflation, Philadelphia Fed reports
  • Crude Oil Trade Technical Update January 24th

    Crude Oil Trade Technical Update January 24th

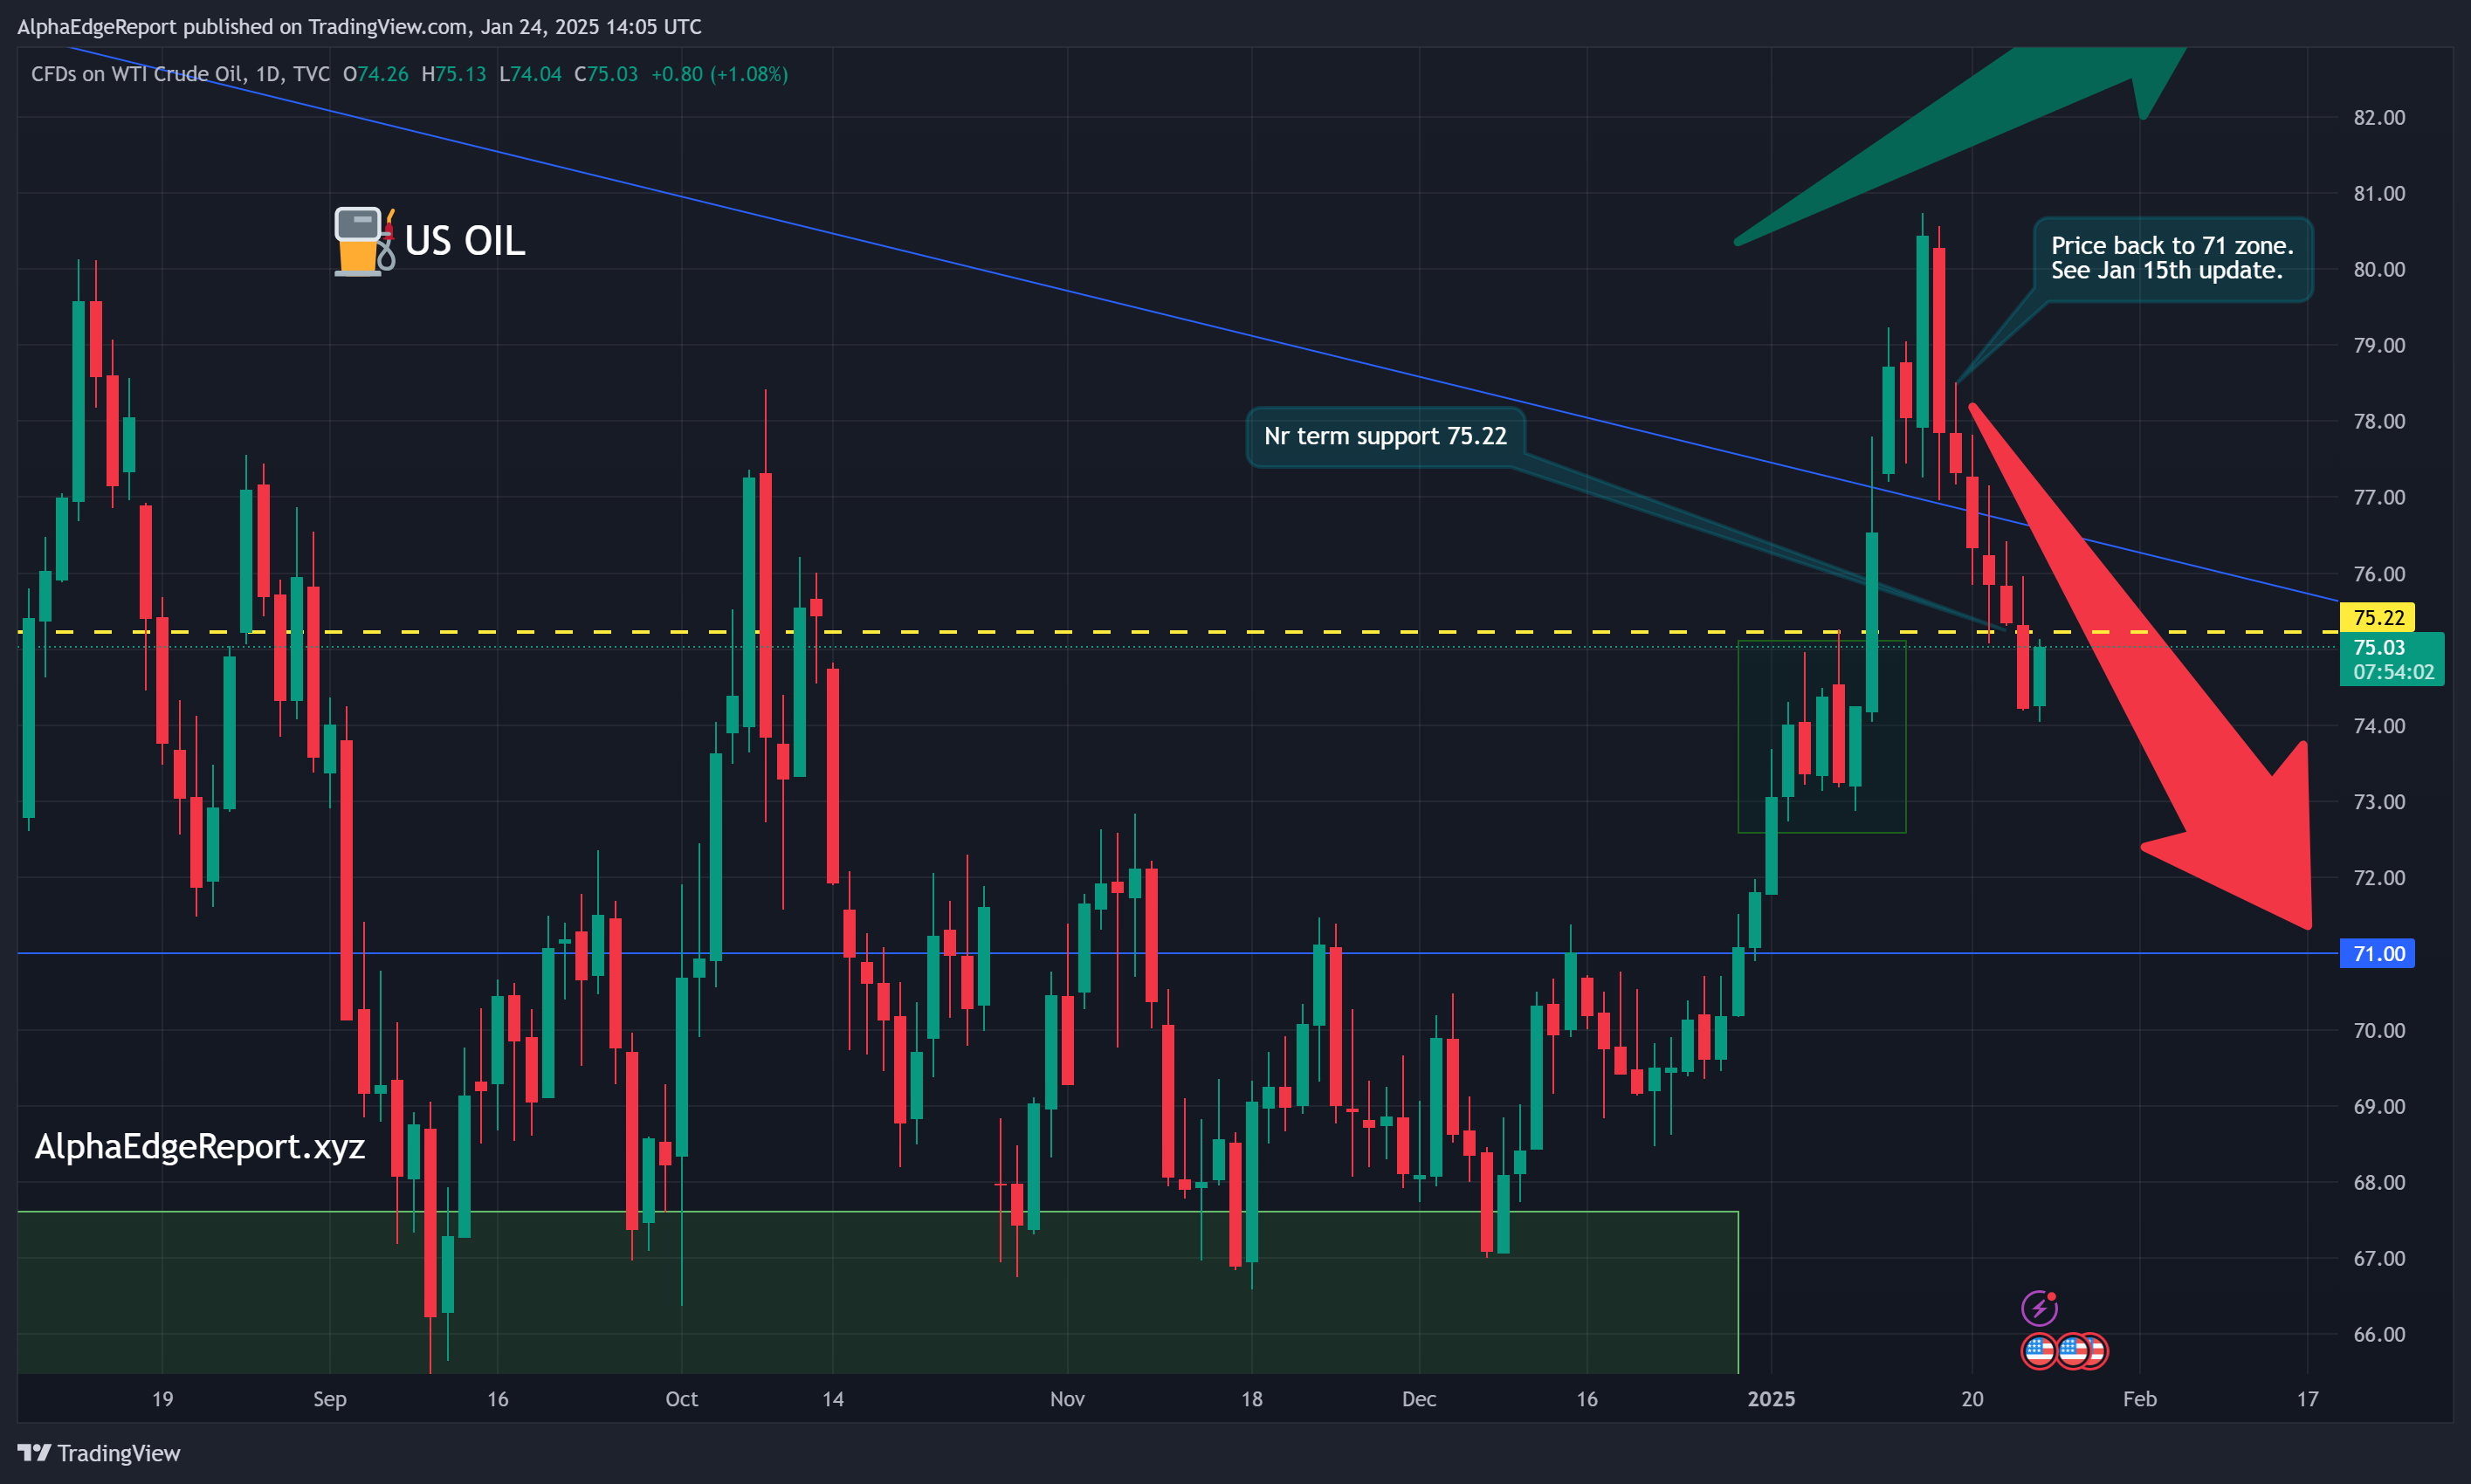
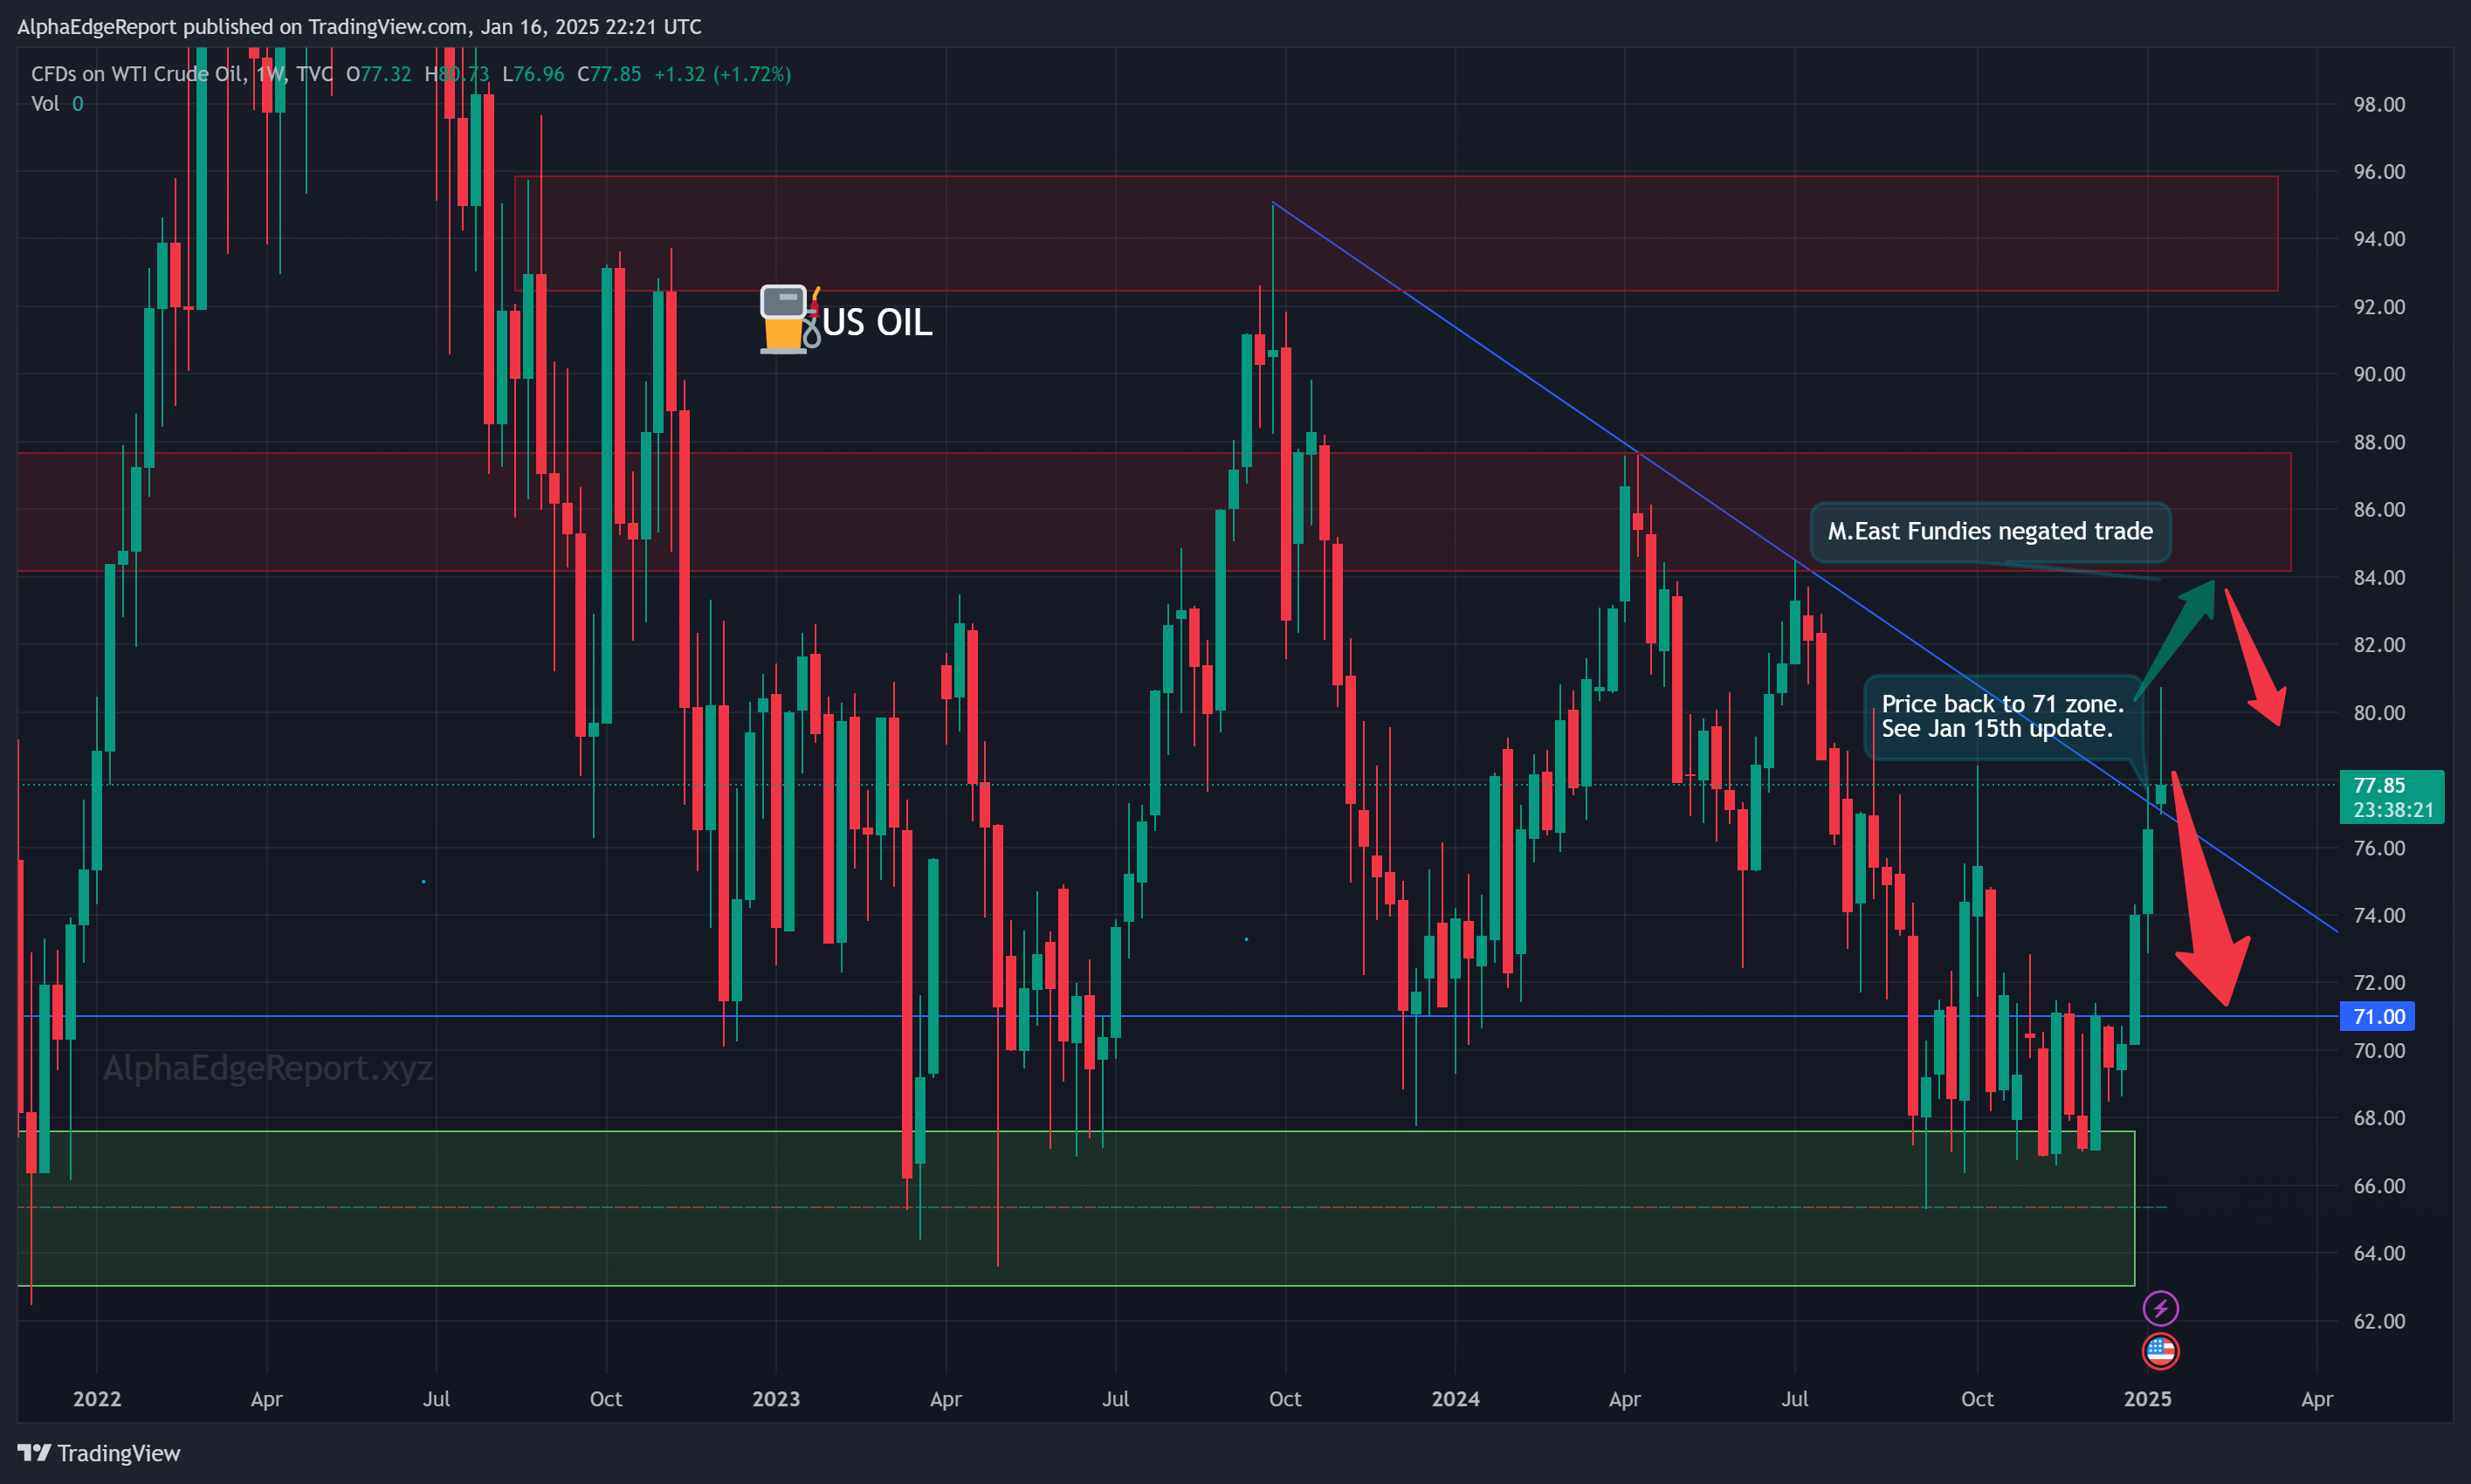
    US Oil has broken our near term support at $75.22 (yellow line), and looks to be breaking down to the $71 price zone as outlined in previous reports. Its hard to see this as a pullback in a bullish daily trend. Beyond any fundamental catalyst, we don’t see any case for price to regain the $81 area just now. Indicators aside, both 4-hour and weekly charts are unambiguously bearish.

    Its Friday and so we are sidelined until after the weekend.

    Stay sharp and good luck with your trading.


    Bitcoin breaks $100K brent oil BTCUSD ceasefire CL_F CPI data crude oil Cryptocurrency market performance day trading Dollar strength DXY FED Forex analysis Forex market analysis geo-politics GOLD Gold price surge January 2025 Inflation impact on markets Israel-Hamas macro investing macro market newsletter macro markets macro report macro trading market analysis Market trends January 2025 market volatility Middle East Oil price volatility OPEC technical analysis trading strategies treasury yields Trump tariffs U.S. stock market rally UK Gilts USDJPY US inflation US Oil USOIL VIX Weekly market recap WTI XAUUSD XTIUSD

  • The Evolving Dynamics of the US Oil Market

    The Evolving Dynamics of the US Oil Market

    The global oil market finds itself navigating uncertain waters as U.S. policies and broader geopolitical developments continue to shape its trajectory. At the center of this uncertainty is the impact of proposed tariffs by President Trump, which could fundamentally alter the supply and demand dynamics of oil in both domestic and international markets.

    Click for concise version

    The Tariff Effect: A Double-Edged Sword

    President Trump’s proposed tariffs on imports from Canada, Mexico, and other nations promise to shake the oil market to its core. These policies, aimed at addressing trade imbalances, may inadvertently raise U.S. gasoline prices by $0.25 to $0.75 per gallon due to retaliatory measures and increased production costs. The uncertainty surrounding these measures has already begun to influence crude oil prices, with analysts warning of fluctuations and volatility.

    Globally, the ripple effect of these tariffs could create supply disruptions while dampening demand growth. WTI crude oil, trading around $75 per barrel, remains under pressure as markets grapple with these evolving challenges. While increased U.S. production could offset some of the adverse effects, the broader economic implications suggest a prolonged period of instability.

    Price Trends: Mixed Signals in a Volatile Market

    WTI crude oil currently hovers at $75 per barrel, constrained by competing market forces. On the one hand, easing geopolitical tensions in regions like Gaza have tempered fears of supply disruptions. On the other, growing U.S. crude stockpiles exert downward pressure.

    Key price levels provide a glimpse into the market’s short-term trajectory:

    Support: Prices find buyers around the $70-$72 range, a critical level that has historically signaled a rebound.

    Resistance: Selling pressure is evident at the $78-$80 zone, keeping prices from breaking out.

    Technically, the market remains at a crossroads. The infamous “death cross,” where the 50-day exponential moving average (EMA) remains below the 200-day moving average, underscores the bearish sentiment. Yet, indicators like Bollinger Bands and the Relative Strength Index (RSI) suggest pockets of optimism, pointing to potential bounce zones around $75-$76. The MACD, meanwhile, offers a glimmer of bullish hope, reflecting underlying momentum.

    Inventory Builds and the Supply Conundrum

    The U.S. oil inventory picture reveals a steady increase in crude and refined products, signaling robust supply. In the week ending January 17:

    Crude stocks rose by 958,000 barrels.

    Gasoline inventories surged by 3.23 million barrels.

    Distillate stocks increased by 1.88 million barrels.

    These builds further reinforce the downward pressure on oil prices, particularly as U.S. energy policies prioritize ramping up domestic production. President Trump’s energy emergency declaration, which aims to streamline infrastructure development and ease environmental restrictions, is expected to support higher output levels in the near term.

    Market Sentiment: Balancing Hope and Fear

    Market analysts describe the current environment as one driven by mixed signals. The optimism stemming from potential production increases and geopolitical stability is counterbalanced by lingering fears of reduced demand growth. Trump’s tariff threats against major trading partners, including Canada, Mexico, and the European Union, add another layer of complexity, creating an atmosphere of cautious pessimism.

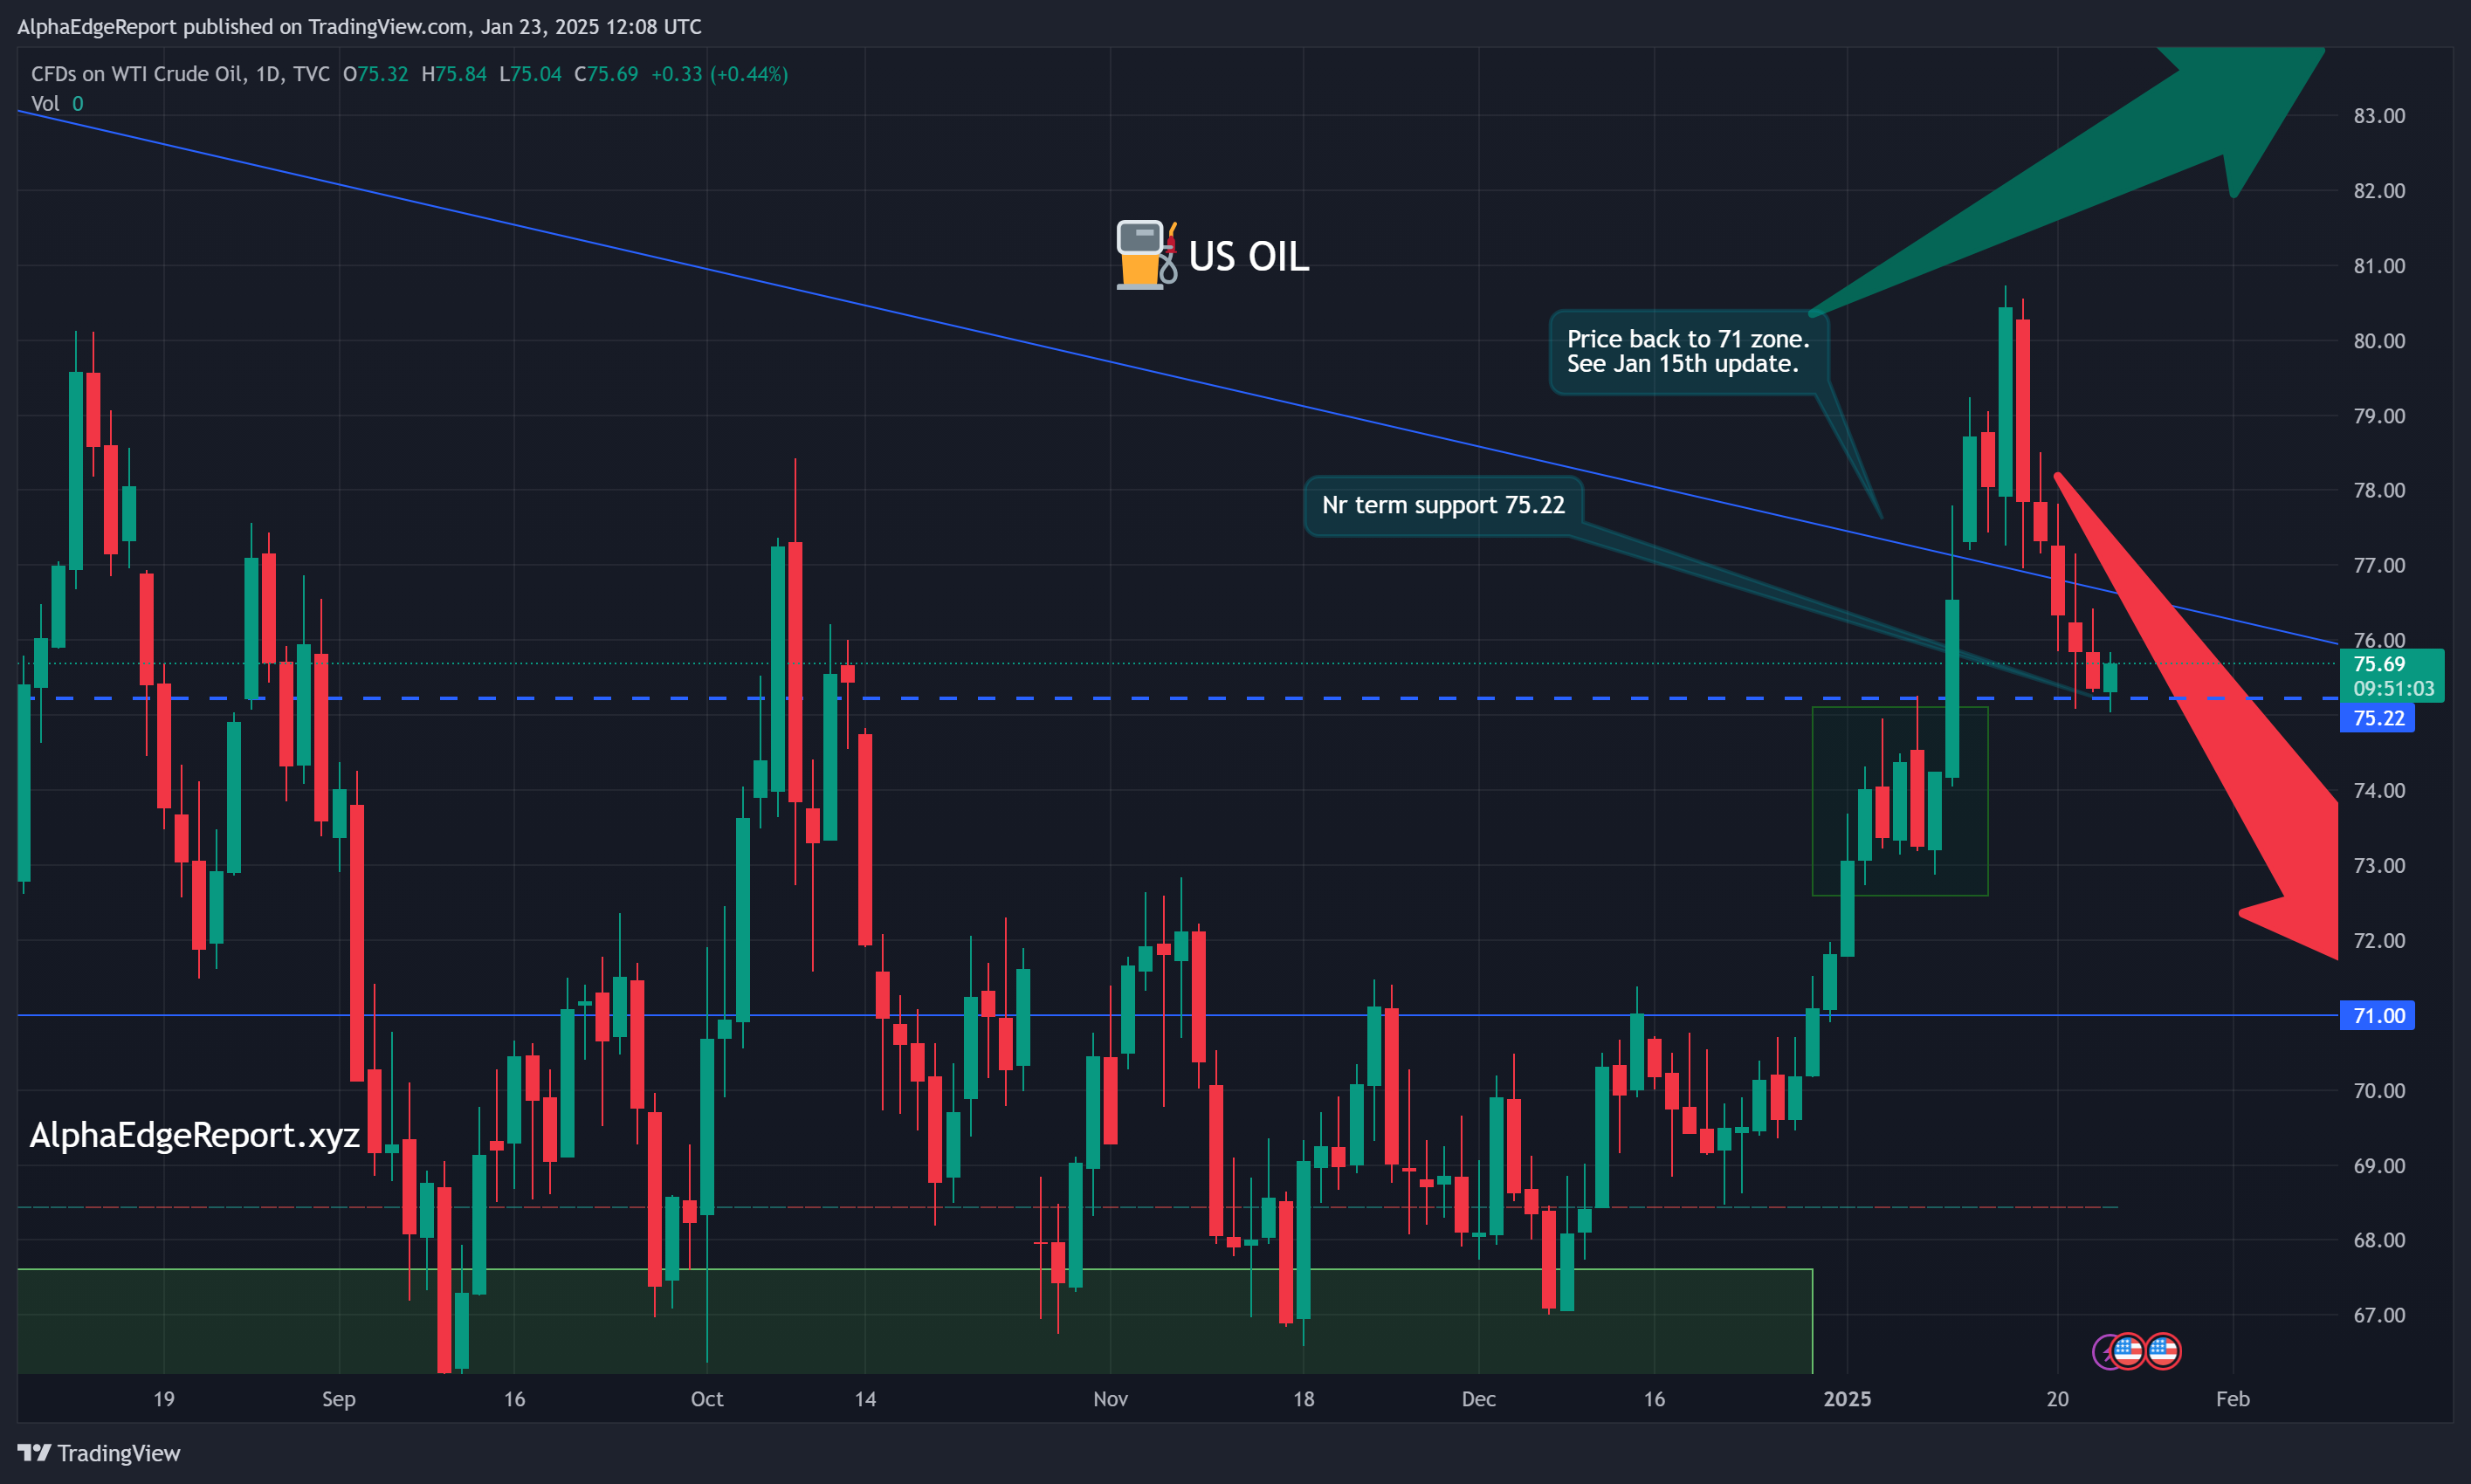
    For traders, the near-term outlook remains challenging. Price volatility is expected to persist, with a potential dip to $71 as the market seeks liquidity before finding support for an upward trend. Our analysis recommends a cautious approach, focusing on selling zones in the $76.20-$77.70 range.

    The Bigger Picture: Risks and Opportunities Ahead

    As the oil market braces for more turbulence, the key risks revolve around U.S. trade policies and global economic uncertainty. Trump’s aggressive stance on tariffs, coupled with the possibility of further sanctions, introduces an unpredictable element to the equation. At the same time, increased U.S. production provides a buffer, offering hope for a more balanced market in the long run.

    The story of oil, as it unfolds in 2025, is one of resilience amidst adversity. With shifting policies and fluctuating prices, the market’s future hinges on the delicate interplay of domestic production, global demand, and the ever-present spectre of political intervention. For now, traders and analysts alike must navigate these complexities with caution, keeping an eye on both the risks and opportunities that lie ahead.


    US Oil Market Update Summary January 23rd

    Impact of Trump’s Tariffs on Oil Prices

      Domestic Impact: Proposed tariffs on Canada, Mexico, and other trade partners could increase U.S. gasoline prices by $0.25 to $0.75 per gallon due to retaliation and higher production costs. These policies create volatility in crude oil prices, affecting both supply and demand.

      Global Impact: Global oil prices, particularly WTI crude (currently around $75/barrel), are pressured by uncertainty about the tariffs, leading to potential supply disruptions and dampened demand growth.

      Current Price Trends

      • WTI Crude Oil: Trading around $75 per barrel as of January 23.
      • Key Levels:
        • Support: $70-$72 (areas of prior buying interest).
        • Resistance: $78-$80 (areas of selling pressure).
      • Technical Indicators:
        • Moving Averages: The “death cross” (50-day EMA below 200-day MA) suggests bearish sentiment.
        • Bollinger Bands: Price is above the middle band, showing potential short-term bullishness.
        • RSI: Around 54-59, indicating $75-$76 as a bounce zone.
        • MACD: Daily view remains bullish.

      Market Drivers

      • Mixed Market Factors:
        • Positive: Easing geopolitical risks in Gaza and potential U.S. production increases under pro-drilling policies.
        • Negative: Higher U.S. crude stocks and gasoline inventories, with stock levels rising as follows:
          • Crude: +958,000 barrels (week ended Jan 17).
          • Gasoline: +3.23 million barrels.
          • Distillates: +1.88 million barrels.
      • Uncertainty: Lack of clarity on Trump’s tariff policies and increased U.S. oil supplies could cause near-term volatility and downward price movements.

      Outlook

      Short-term bearish outlook remains dominant due to mixed technical and fundamental factors. Prices may drop to $71 to seek liquidity before resuming an upward trend. Selling zones are identified at $76.20-$77.70.

      Key Risks

        Ongoing trade uncertainties from Trump’s policies, potential new tariffs, and global economic slowdowns could weigh heavily on oil market stability.

        Thus, oil prices and market trends remain heavily influenced by U.S. trade policies, reflecting the ongoing bearish sentiment in the market.


        Bitcoin breaks $100K brent oil BTCUSD ceasefire CL_F CPI data crude oil Cryptocurrency market performance day trading Dollar strength DXY FED Forex analysis Forex market analysis geo-politics GOLD Gold price surge January 2025 Inflation impact on markets Israel-Hamas macro investing macro market newsletter macro markets macro report macro trading market analysis Market trends January 2025 market volatility Middle East Oil price volatility OPEC technical analysis trading strategies treasury yields Trump tariffs U.S. stock market rally UK Gilts USDJPY US inflation US Oil USOIL VIX Weekly market recap WTI XAUUSD XTIUSD

      1. Short-Term Energy Outlook, January 2025

        Short-Term Energy Outlook, January 2025

        The following is a brief summary and takeaway of the EIA (Energy Information Administration) Short-Term Energy Outlook (STEO) January publication.

        Outlook for Oil Prices:

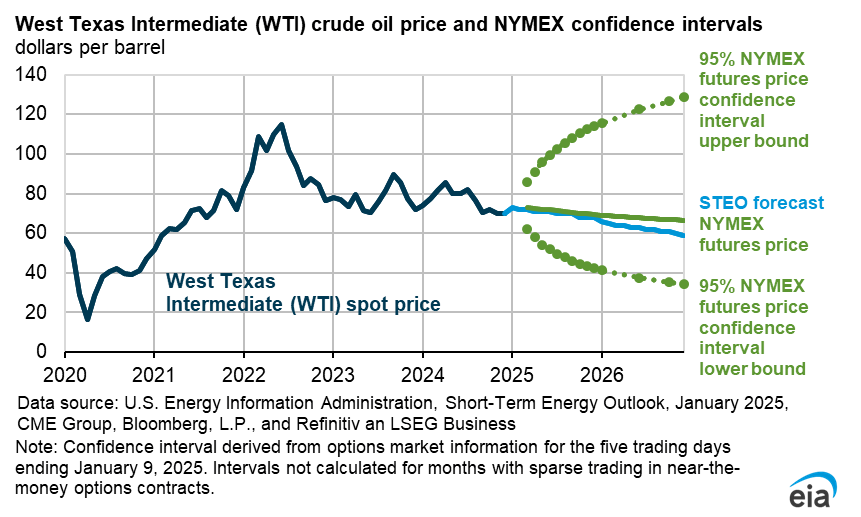
        • Near-term (2025): Prices may remain stable or decline slightly after Q1 2025 due to stock builds and slower demand growth.
        • Mid-term (2026): Brent oil prices are forecasted to drop significantly, driven by oversupply and reduced growth in global demand, especially from OECD countries.
        WTI crude oil price

        Reasons for OPEC Actions:

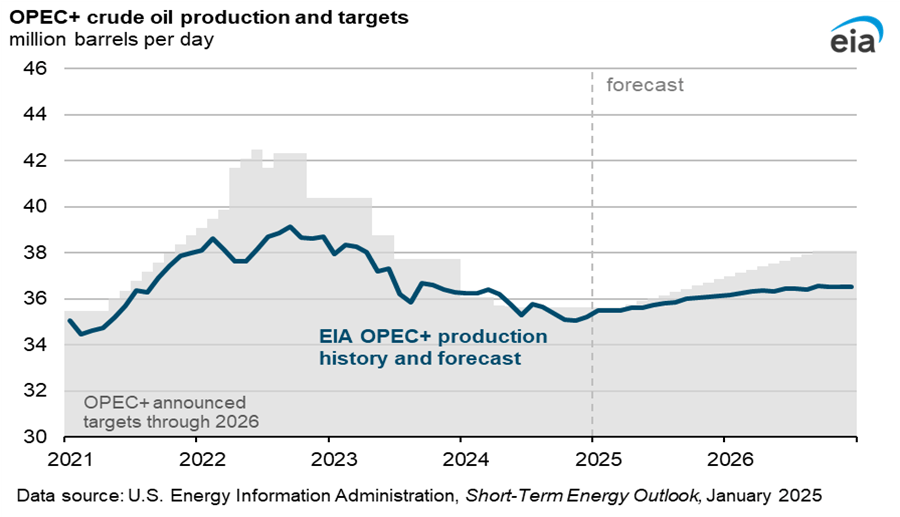
        • Stabilizing market share: OPEC+ is increasing output incrementally to meet anticipated demand growth while maintaining influence over prices.
        • Balancing commitments and capacity: Despite higher output, production will likely fall short of announced targets due to internal constraints and deliberate measures to prevent excessive price declines.
        • Strategic responses to competition: OPEC’s actions reflect an effort to remain competitive against non-OPEC producers like Brazil, Canada, and Guyana, which are contributing significantly to global supply growth.
        OPEC+ Crude Oil Production

        Takeaway:

        • Global oil production is projected to grow moderately: OPEC+ production is expected to rise annually, though not to the full extent of announced targets. Non-OPEC+ nations will also see steady increases, driven by Brazil, Canada, and Guyana.
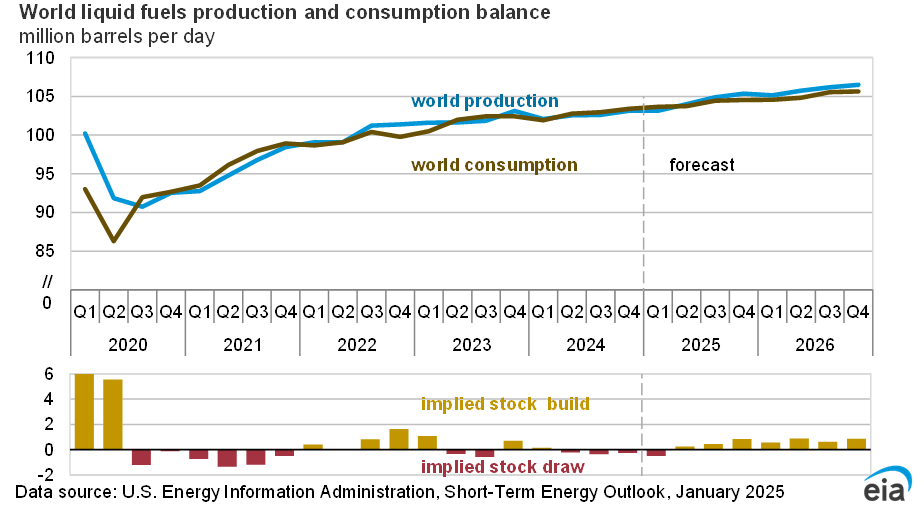
        • Market balance pressures: While output grows, Brent oil prices are expected to drop after Q1 2025 due to stock builds and reduced OECD demand growth in 2026.
        • US oil output nearing a plateau: Growth in tight oil regions like the Permian Basin is barely offsetting declines elsewhere, leading to marginal increases by 2026.
        World liquid fuels production & consumption balance
      2. Crude Realities: A Volatile Oil Market Landscape in 2025

        Crude Realities: A Volatile Oil Market Landscape in 2025

        A Closer Look at Oil

        Oil prices are on track for weekly gains of more than 2%. Brent crude rose 0.4% to $81.58 per barrel, while West Texas Intermediate (WTI) crude increased by 0.5% to $79.09 per barrel at last check.

        Factors Driving the Bullish Case

        Despite the Israel-Hamas ceasefire, several fundamental factors continue to support higher oil prices:

        • U.S. Sanctions: Concerns persist over supply disruptions caused by U.S. sanctions on Russian oil producers and tankers.
        • Tightened Sanctions on Russia: Former Treasury Secretary pick Scott Bessent has indicated support for stricter sanctions on Russia, particularly targeting oil majors, as part of efforts to end the war in Ukraine.
        • Tougher Stances on Iran and Venezuela: The Trump administration is expected to adopt a more aggressive policy toward Iran and Venezuela, which could impact global oil supplies.
        • Middle East Tensions: While progress has been made, unresolved geopolitical tensions in the Middle East continue to pose a risk of supply disruptions, adding to market uncertainty.
        • OPEC+ Production Decisions: OPEC+ has delayed production increases, further tightening supply and supporting higher prices.

        Technical Outlook

        On the technical front, crude oil is currently in the overbought zone on the daily chart and is forming a bearish weekly pattern. This suggests the potential for prices to pull back to the $75–$76 range in the near term.

        Looking Ahead

        As we move into 2025, the combination of ongoing supply constraints, shifting economic conditions, and persistent geopolitical tensions points to heightened volatility in oil prices.

      Review Your Cart
      0
      Add Coupon Code
      Subtotal

       
      ×