A Market on Edge
Following the Non-Farm Payrolls (NFP) report on January 10, 2025, financial market sentiment has shifted notably. U.S. Treasury yields surged as investors reacted to stronger-than-expected job growth, raising concerns about persistent inflation and the Federal Reserve’s interest rate policies. In the UK, investor sentiment turned negative due to rising gilt yields linked to specific fiscal challenges and inflationary pressures from recent budget measures. Overall, markets are bracing for potential volatility as economic data influences central bank strategies amid a backdrop of heightened uncertainty.
Post-NFPs on January 10, 2025, the stock market reacted negatively despite positive job growth data. Investors reassessed the likelihood of central bank rate cuts, leading to higher government bond yields, particularly affecting high-valuation sectors like technology. The Nasdaq fell by 2.3%, while defensive sectors like utilities performed better. Overall, the Dow Jones and S&P 500 also declined by 1.9% each, reflecting a cautious outlook as markets adjusted to the implications of the labor report on monetary policy expectations.
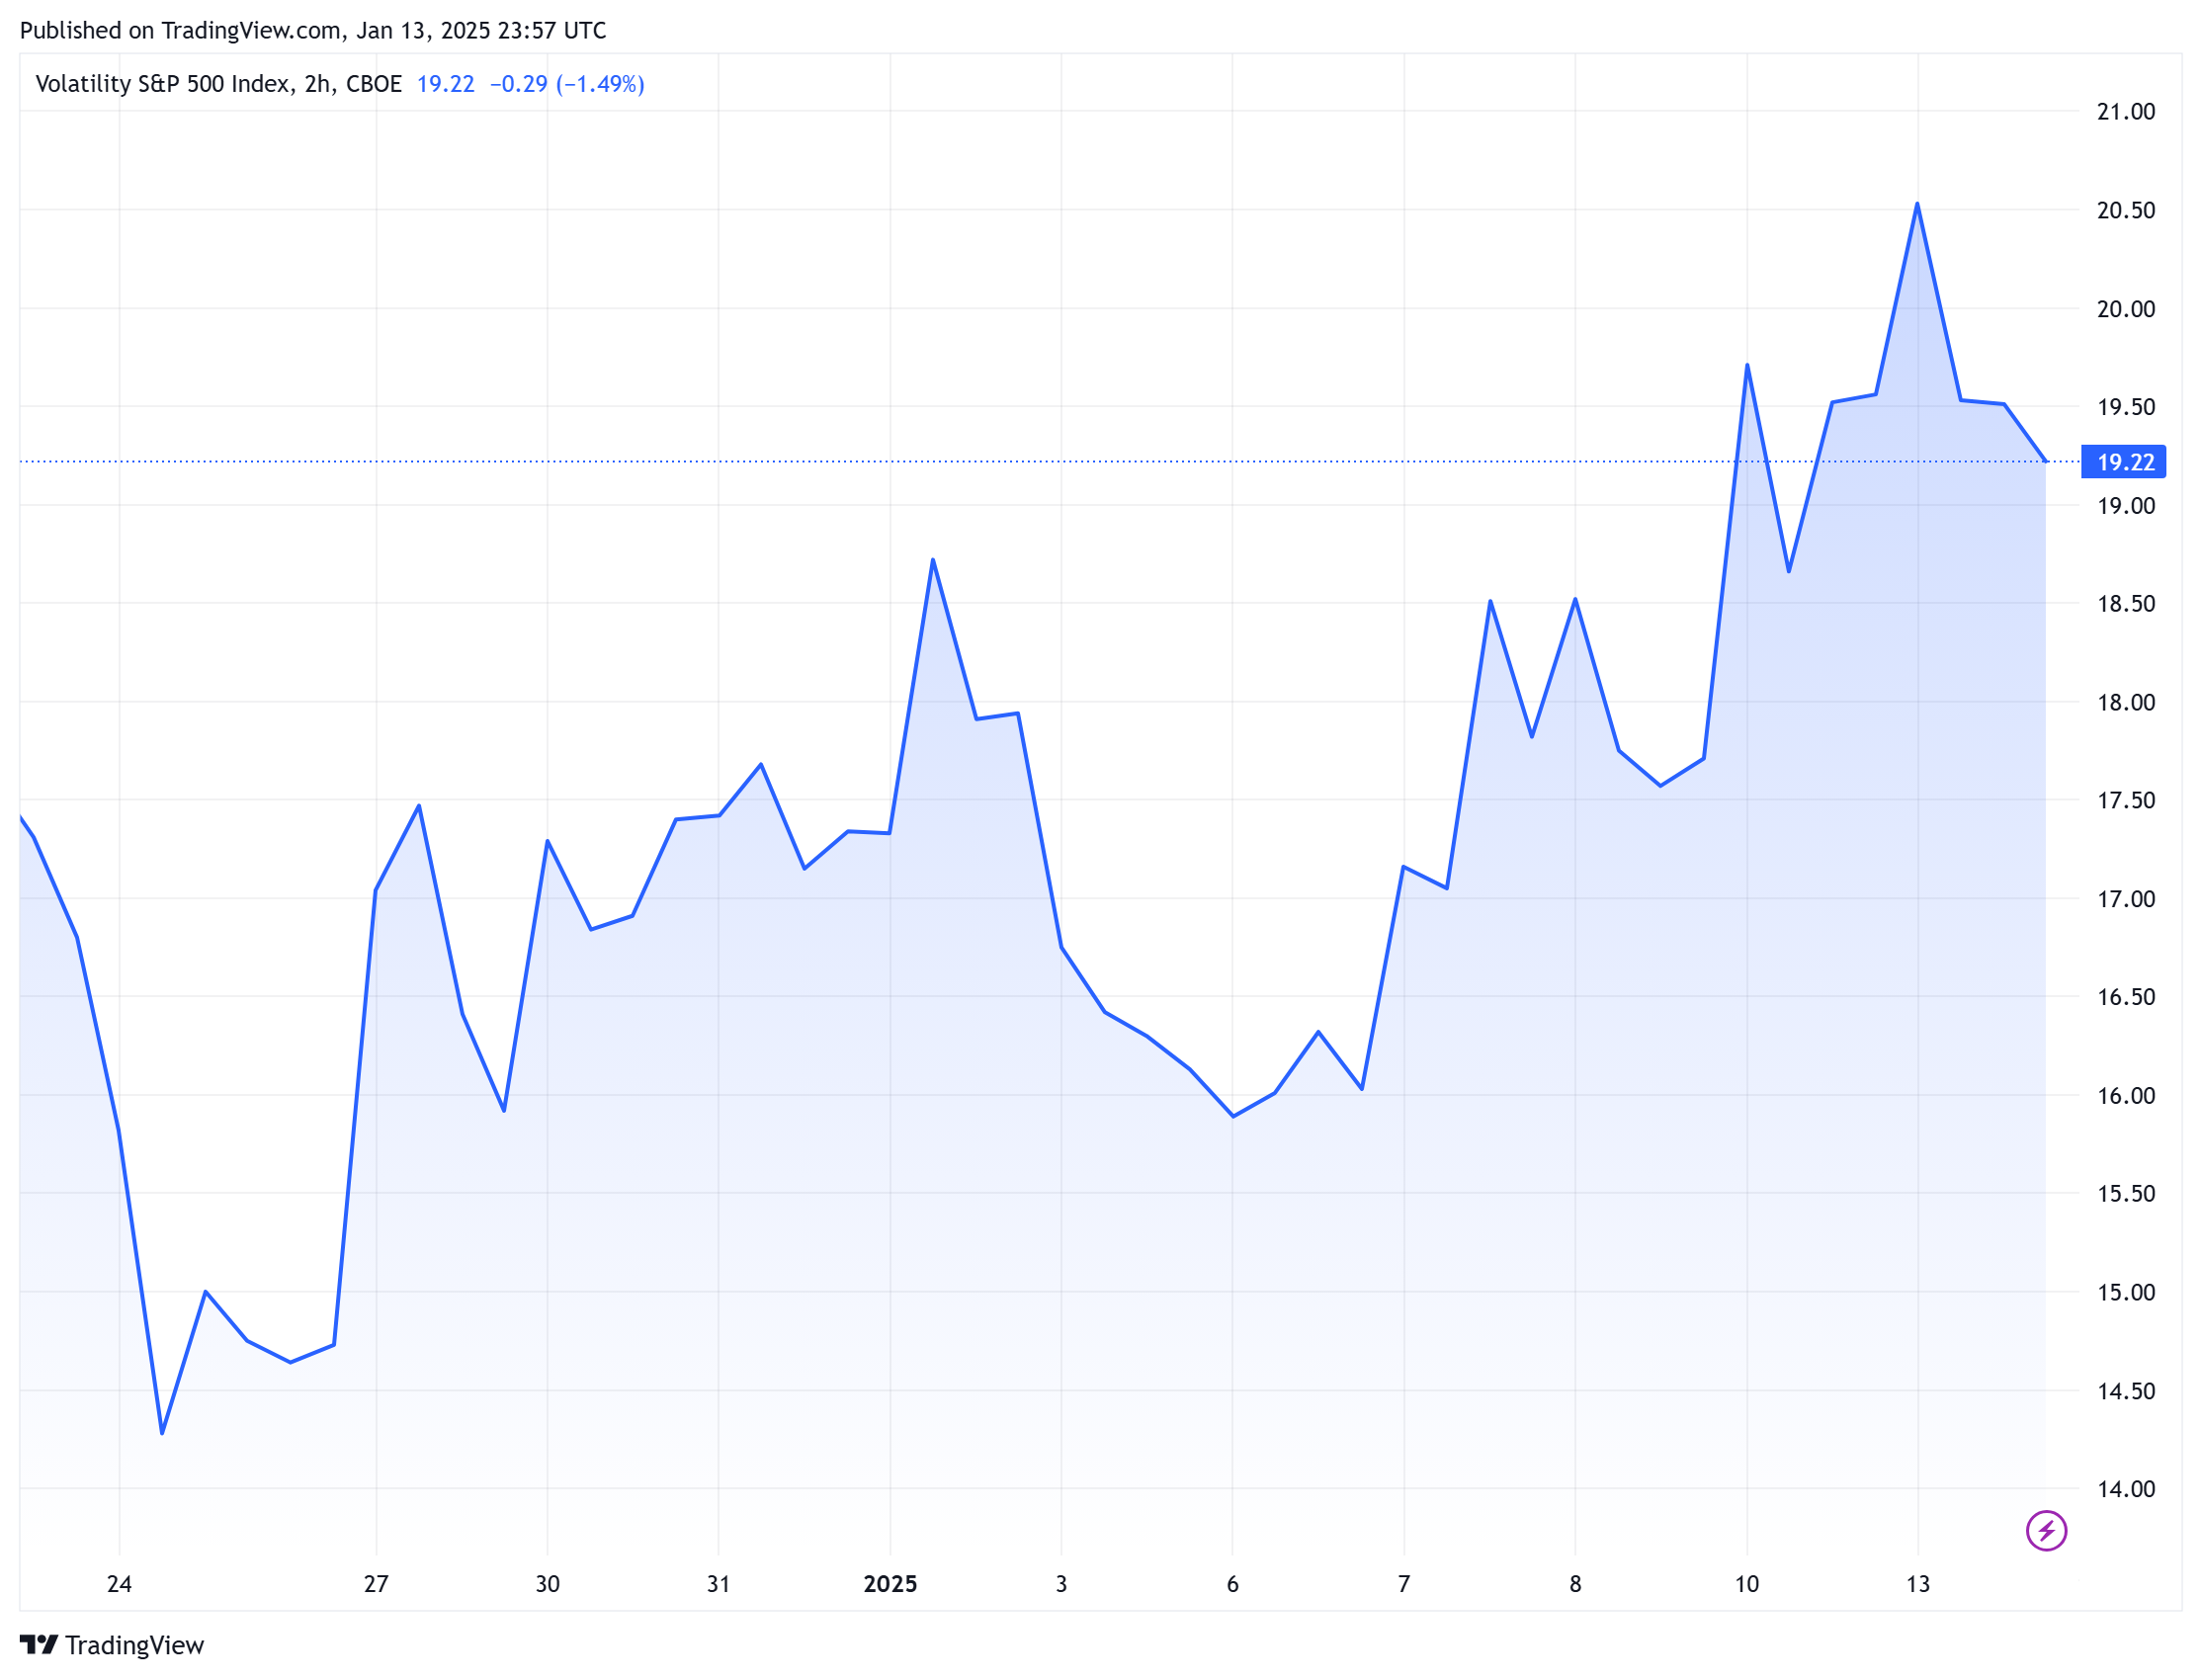
As of January 13, 2025, the CBOE Volatility Index (VIX) is at 19.54, having increased by 8.1% from the previous day. This rise indicates heightened market volatility expectations, often referred to as the “fear gauge.” A VIX level above 20 typically suggests increased uncertainty among investors regarding future market movements. Therefore, the current VIX reading indicates a notable level of anticipated volatility in the market today.
Sector Spotlight: Oil, Gold, and Crypto
After the January 10th Non-Farm Payrolls (NFP) report, which indicated a stronger-than-expected job growth of 256,000, sectors like oil, gold, and crypto experienced notable movements:
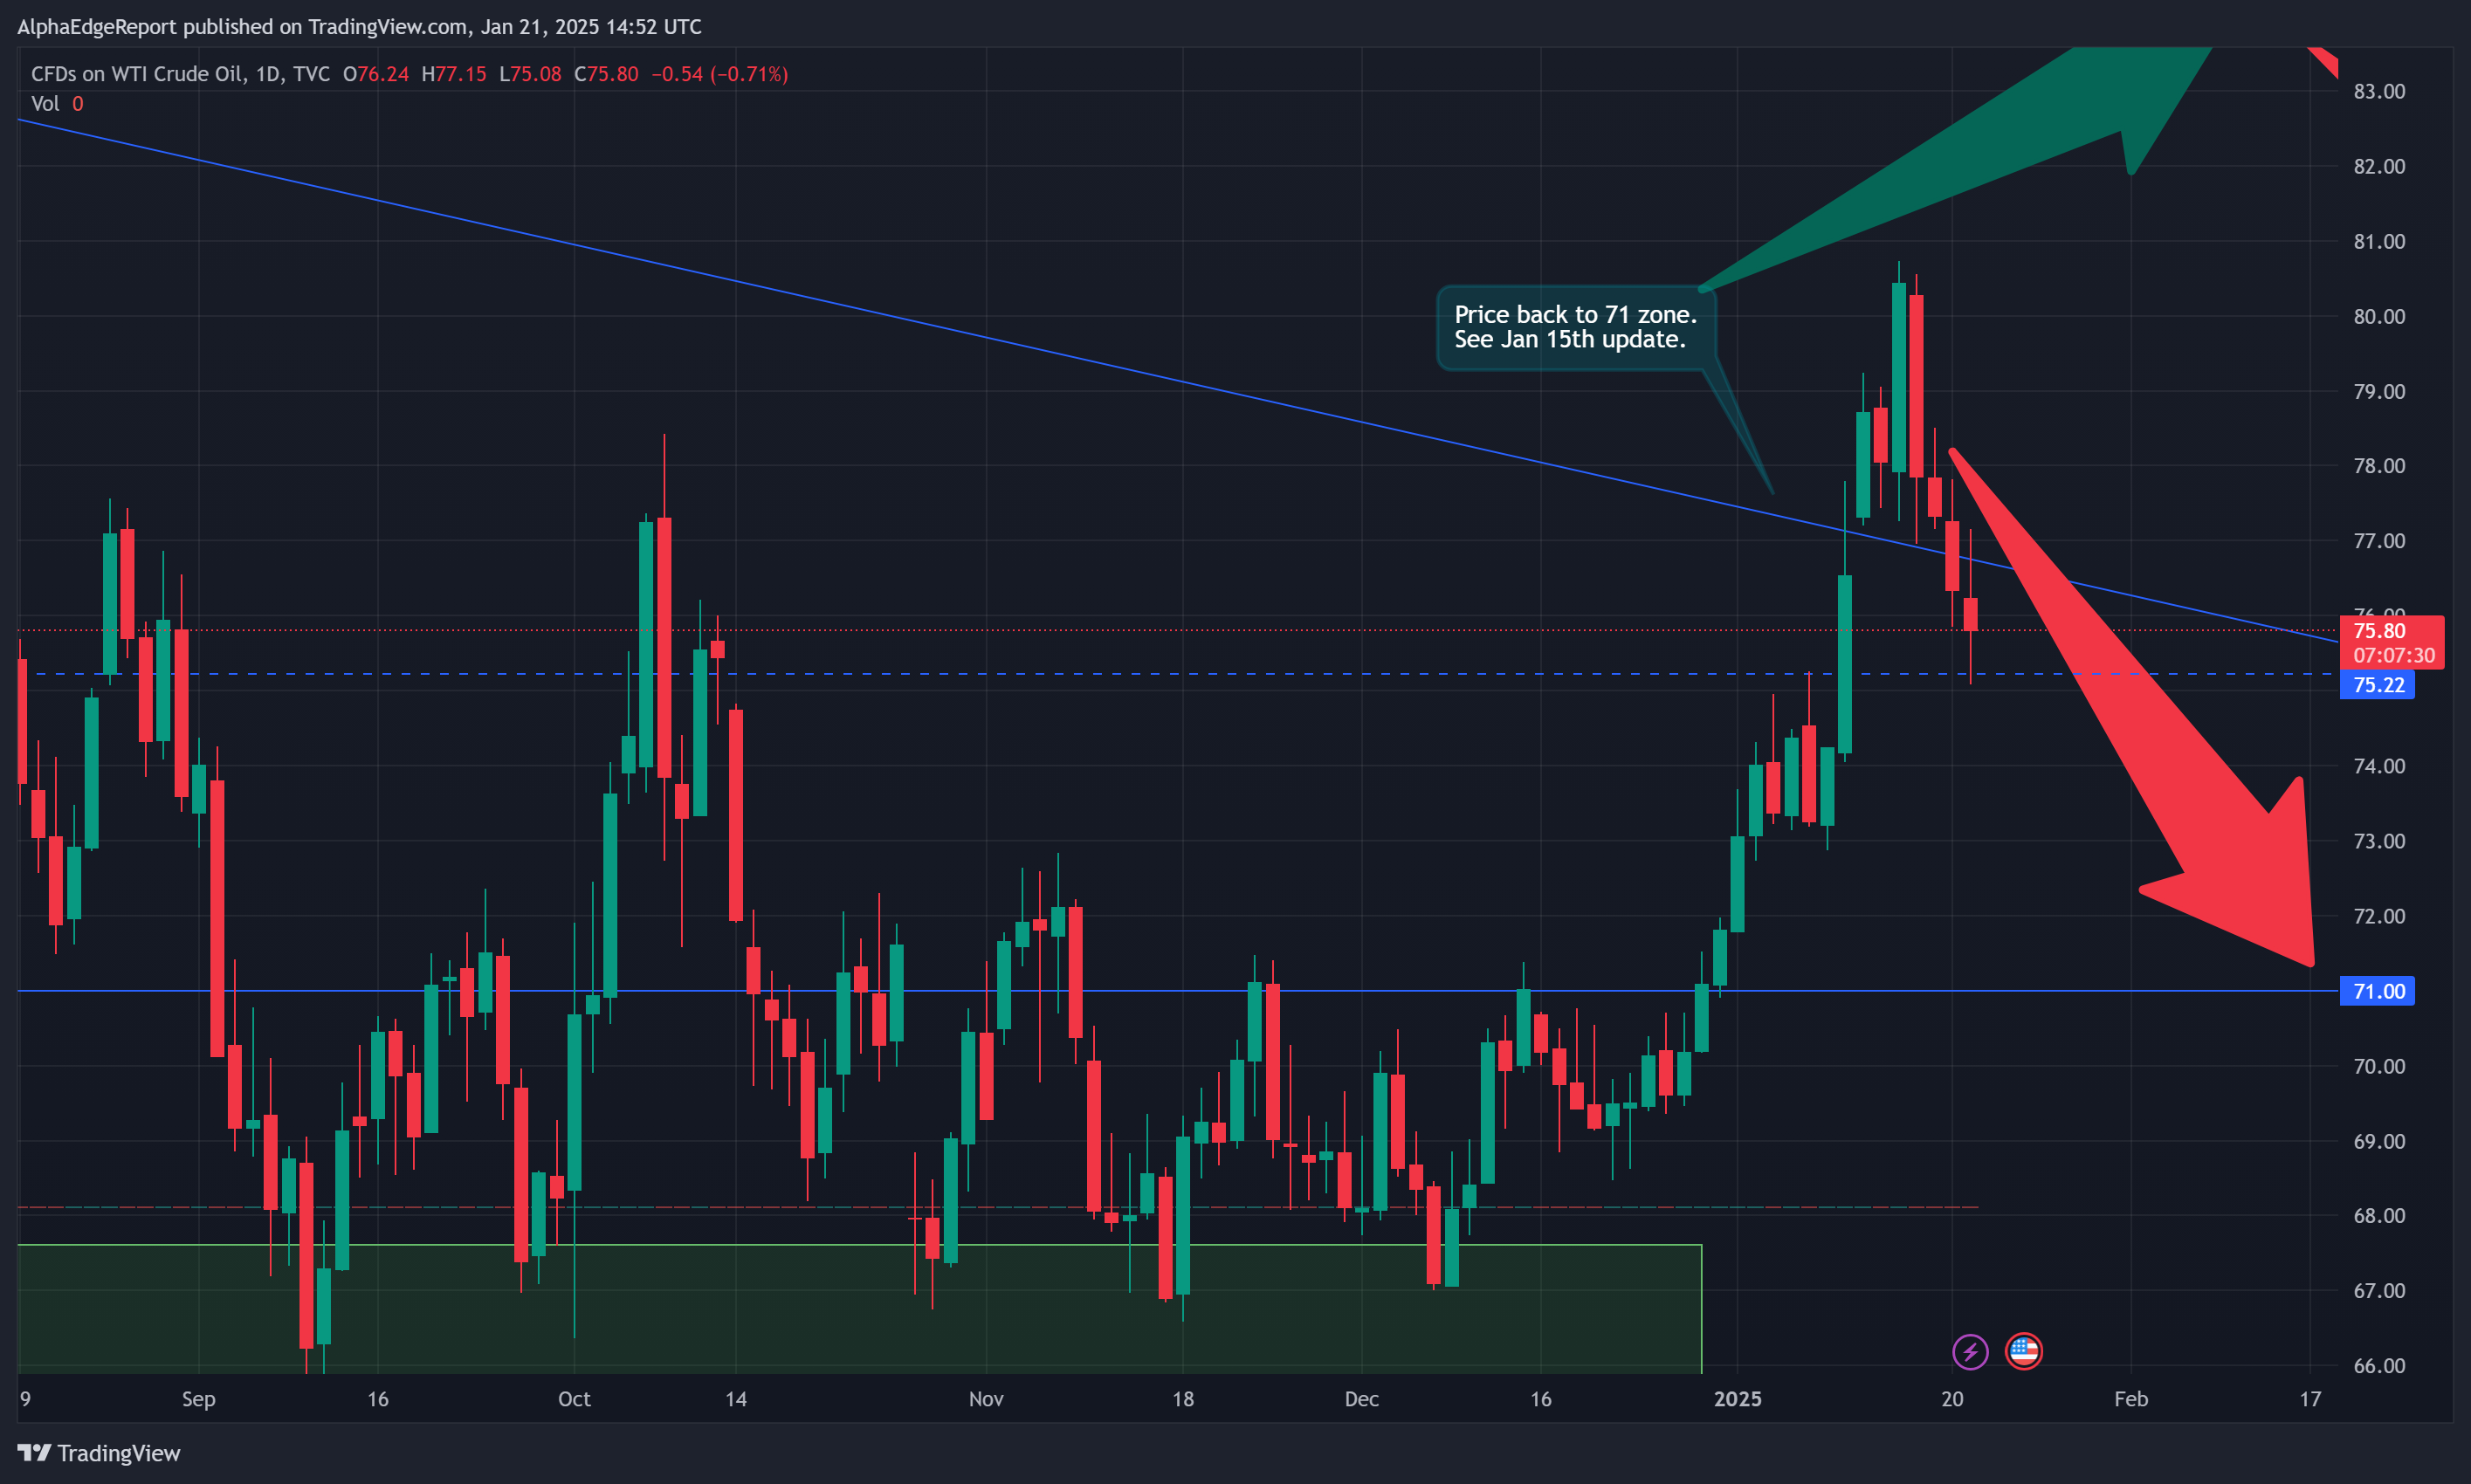
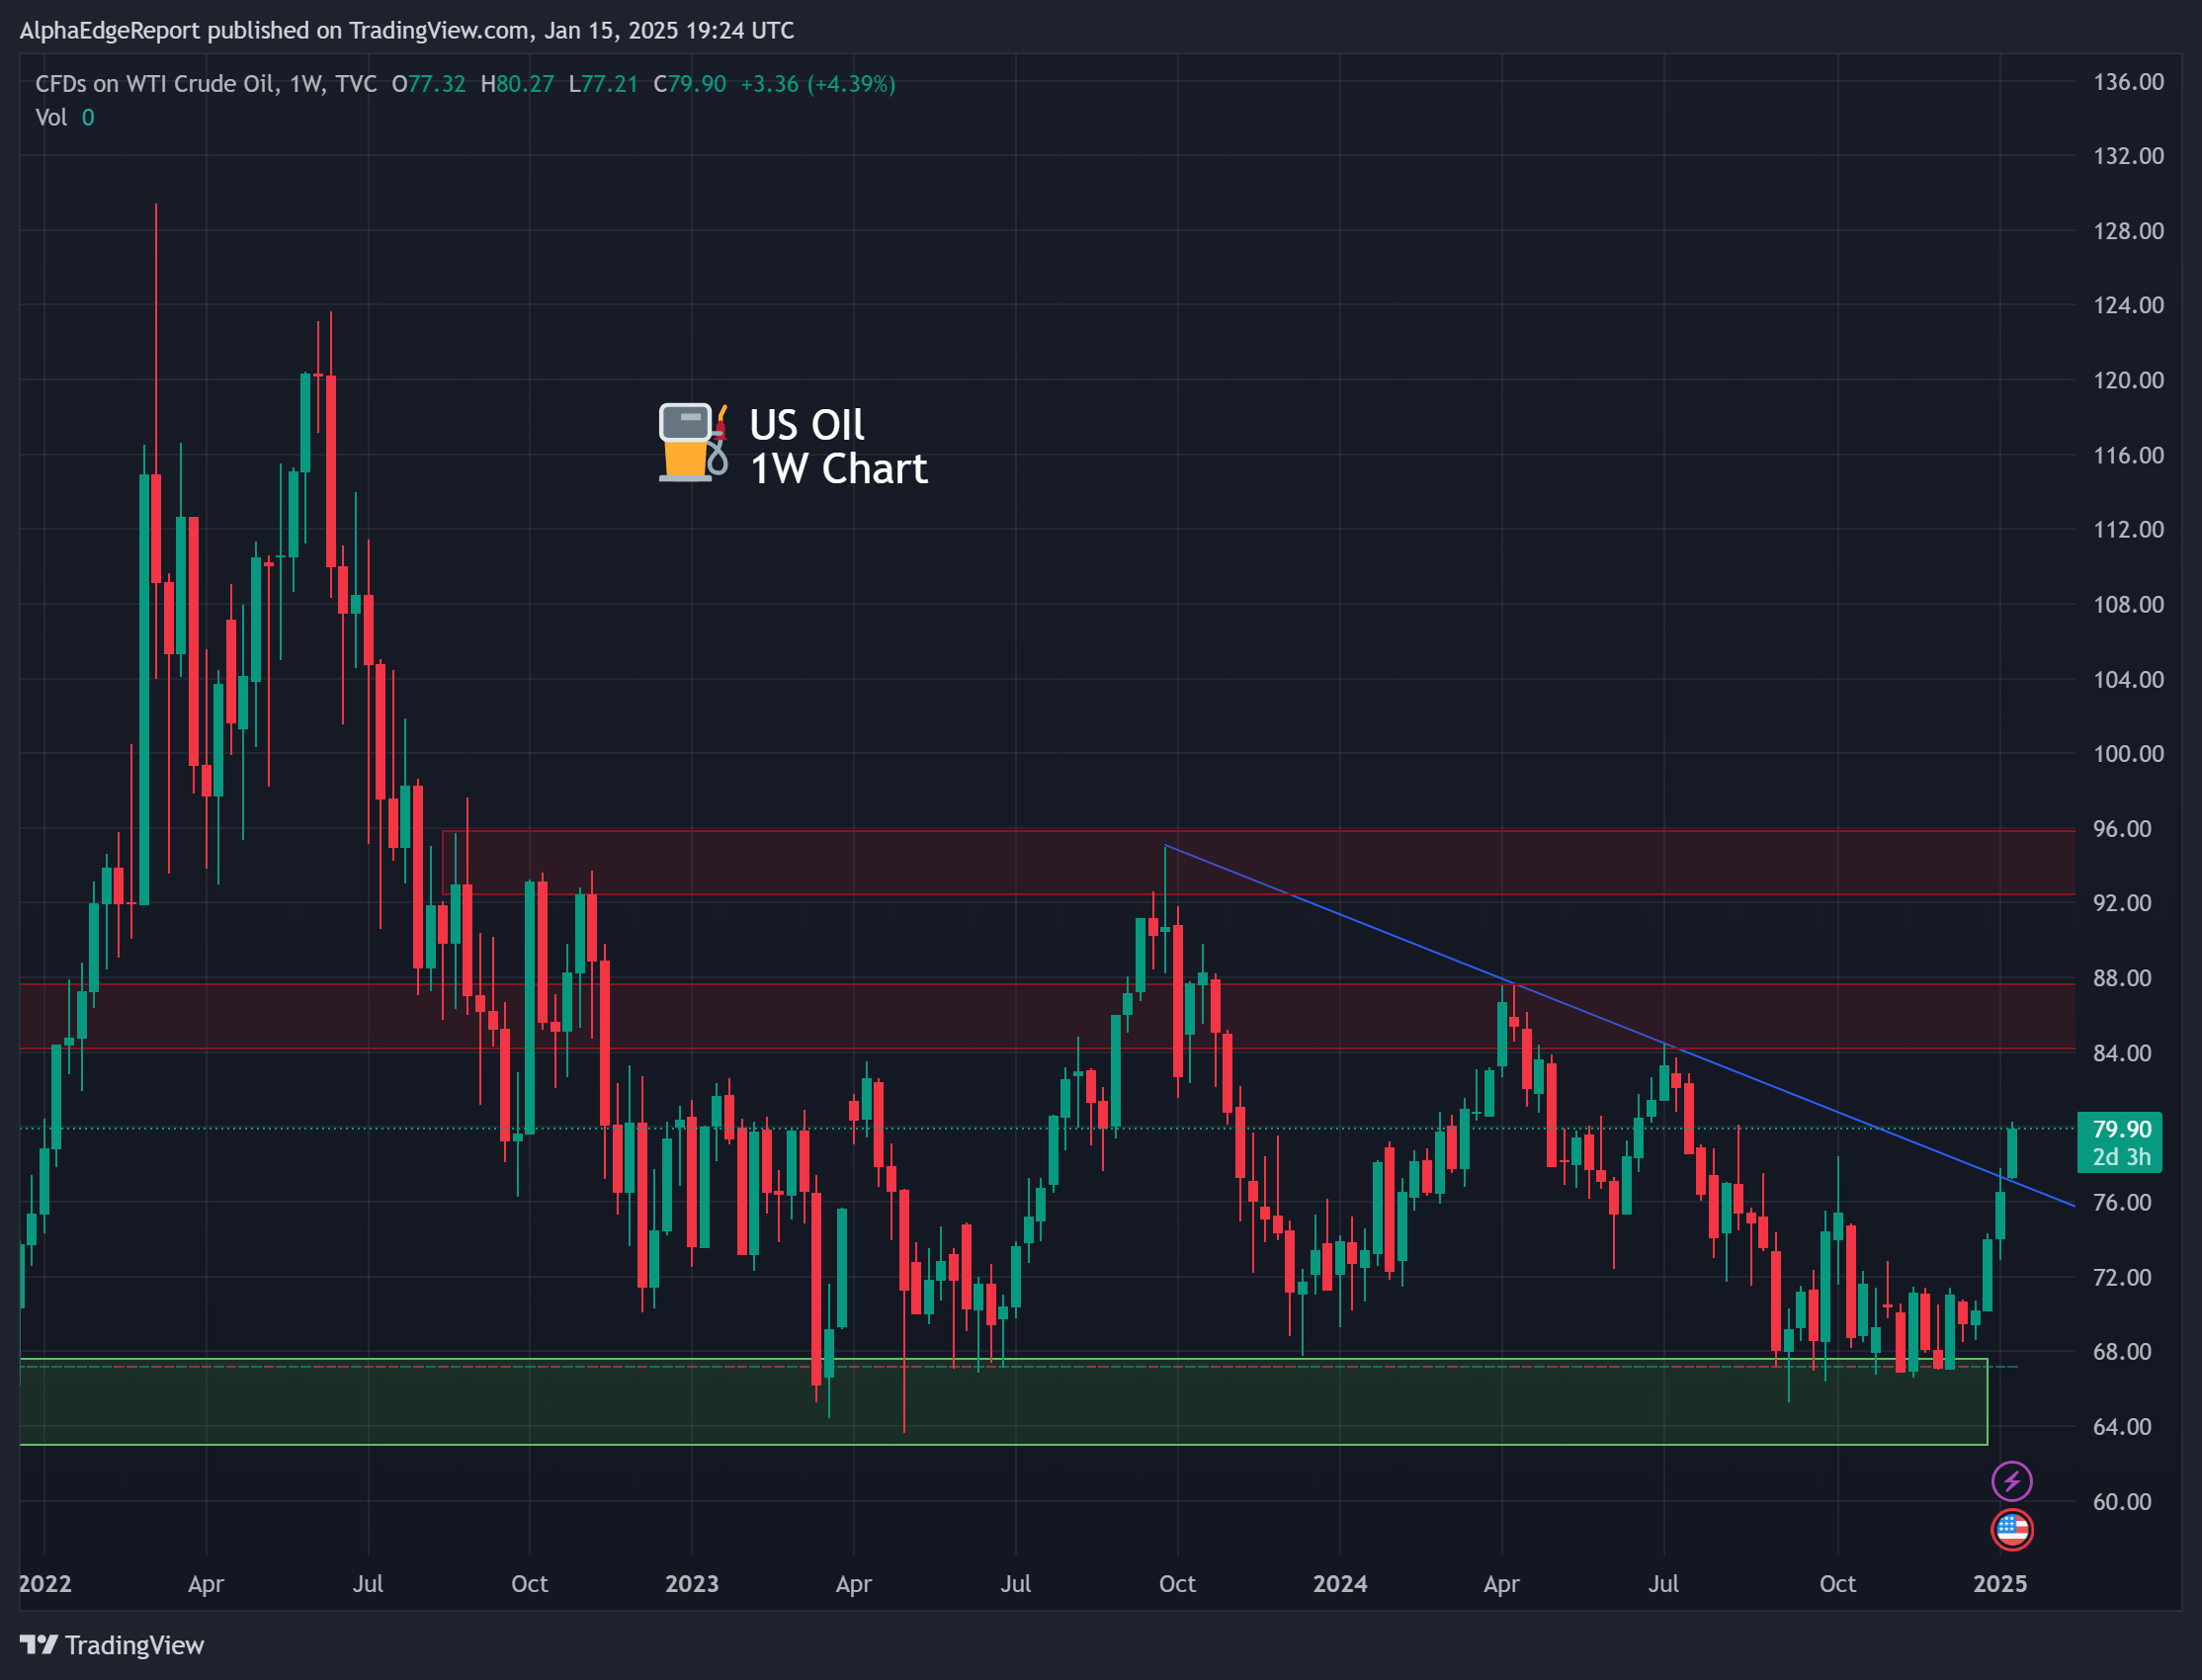
- Oil: Prices surged, reaching four-month highs due to increased demand and inflation concerns. Some market commentators noted that this positive trend was supported by expectations of economic growth in China and rising winter fuel demand. However, US pressure on Iran remains a dominant narrative, translating to a near-term bullish case for oil.
- Gold: The performance of gold remained buoyant but contained within its weekly consolidation triangle, acting as a weak hedge against oil market fluctuations.
- Crypto (Bitcoin): We continue to see Bitcoin as a risk asset rather than a safe haven. Thursday’s sell-off and muted bounce post-NFP kept Bitcoin within its weekly consolidation range of 91,000 – 104,000.
Forex Performance: A Dollar Surge
Following the January 10th NFP report, the forex markets reacted significantly:
- US Dollar (DXY): The DXY surged to its highest level since November 2022, nearing 110.00, driven by strong job growth and reduced expectations for Fed rate cuts in 2025.
- EUR/USD: The euro weakened against the dollar, approaching multi-year lows and parity as the dollar’s strength overshadowed any positive domestic data from Europe.
- USD/JPY: The USD/JPY pair saw modest gains, reflecting expectations of potential policy shifts from the Bank of Japan due to strong US labor market data.
Looking Ahead: CPI Inflation Data
Analysts are cautiously optimistic about market performance in the coming days, particularly with the upcoming CPI inflation data. Expectations are for modest inflation, with forecasts suggesting a CPI of around 2.4% for 2025, down from 2.9% in 2024.
The strong labor market could bolster the US dollar further, impacting forex rates like EUR/USD and USD/JPY negatively. In the stock market, analysts predict continued gains but at a slower pace than in 2024, with a projected S&P 500 target of 6,500, reflecting a roughly 9% increase. However, potential inflationary pressures from incoming policies could introduce volatility.
Trading Strategies
Indices
- SPX Weekly up-trend still intact. Price is currently at dynamic support with the 25 EMA and mid Bollinger Band circa 5827. If the CPI print comes in unfavourably, we see price targeting support around 5650 just off the 50 EMA. Near term BEARISH. Long term BULLISH.
- NASDAQ Long term up trend intact as long as we remain above 18000. As last week’s market moves continue we see price holding at dynamic support around 26800 — 50 EMA and mid Bollinger Band. However divergence on the weekly RSI is more prominent. Underlining the near term bearish case as momentum fades. Near term BEARISH. Long term BULLISH.
Commodities
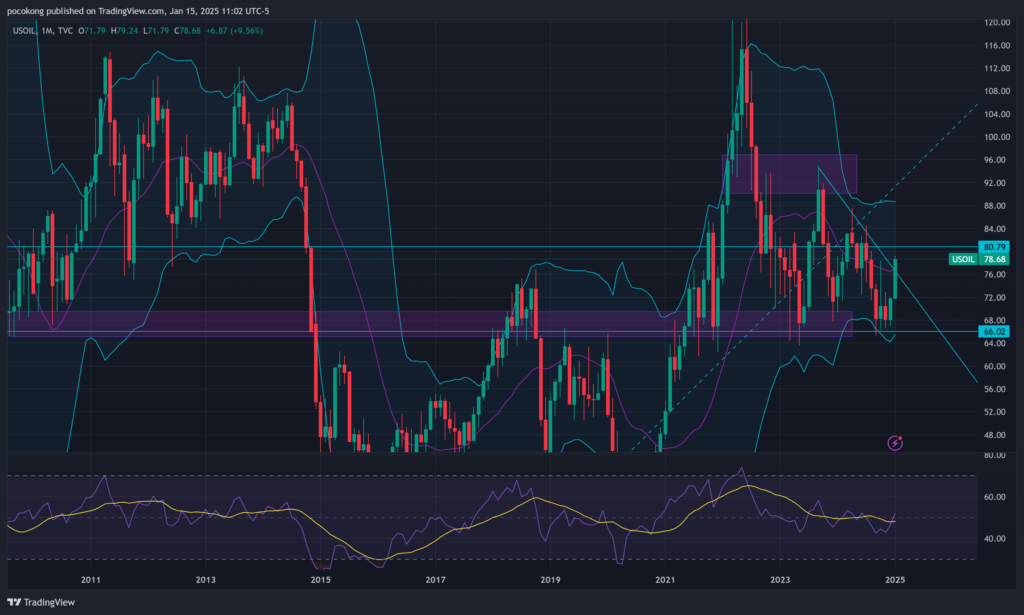
- US OIL Weekly down trend intact. But previously mentioned near term factors maintain the daily bullish case. Note OIL is still contained within a monthly consolidation triangle with support at 66. Monthly and weekly RSI momentum is bullish. Price has already closed above daily resistance at 78 on the 4H chart. A daily close above this level brings the next target of 80 in focus. We remain BULLISH on OIL near term and mid term.
- Gold: As already mentioned, GOLD’s performance remains buoyant, but contained within its weekly consolidation triangle. Near term support is 2600 and resistance at 2730. Price is at multi-year highs we see it remaining BULLISH long term with continued market uncertainty and volatility. Near term RANGE BOUND as price navigates this weekly consolidation.
- Crypto (Bitcoin): Again, Thursday’s sell off and muted bounce post NFPs, kept BItcoin within its weekly consolidation range of 91,000 – 104,000. We have been monitoring this consolidation pattern in BTC and altcoins since mid-December. Failure to maintain 104,000 and strong RSI divergence have kept us bearish. Next targets for BTC is 80,000. Above the last consolidation and dynamic supports 50 EMA and mid Bollinger. Near term BEARISH. Long term BULLISH.
Forex
- US Dollar (DXY): Dollar holla. As noted in our post NFP summary above, USD remains strong across the board. Price and RSI momentum are bullish on all charts including weekly and monthly with healthy pullbacks. Price is on course for all time highs at 114. Near term BULLISH. Long Term BULLISH.
- EUR/USD: Again multi-year lows and parity in sight with USD strength. Near term BEARISH. Long term BEARISH.
- USD/JPY: The pair is at multi-year highs and the only negative we see is possible near term consolidation as price looks to attack at high 161s. Weekly range. Support 140.50 to 160 resistance. So as RSI momentum drops, buy any dips. Near term RANGE. Long term BULLISH.