
By AlphaEdge Macro Research | July 2025
The Liquidity-Driven Market
As Bitcoin consolidates near the $100,000 psychological threshold, a striking consensus emerges from leading analysts: digital gold’s price action has become untethered from its halving cycle origins and is now predominantly driven by global liquidity conditions. The correlation between Bitcoin’s year-over-year performance and changes in the M2 money supply has strengthened to near-parity, with 85% of BTC’s major price movements since 2020 occurring alongside shifts in central bank balance sheets.
This liquidity dependence creates both opportunities and vulnerabilities. On-chain data reveals that long-term holders—typically the bedrock of market stability—have been unusually inactive during the current cycle. The percentage of Bitcoin supply dormant for over a year remains near record highs at 68%, suggesting neither the distribution patterns nor the euphoria typical of cycle peaks. Yet this stability faces mounting pressure from macroeconomic crosscurrents, particularly as the Federal Reserve grapples with what analysts are calling the “stagflation conundrum.”
The Stagflation Catalyst
Recent GDP contractions and resurgent inflation have forced market participants to confront an uncomfortable reality: the U.S. economy appears trapped in a policy vise. The probability of recession hitting 64% by May 2025—as tracked by prediction platform Kalshi—has created what some traders describe as a “perverse bullish case” for Bitcoin.
“The Fed’s worst nightmare is playing out in real time,” notes one market strategist, pointing to the 0.3% GDP miss in Q1 2025 alongside sticky 4.2% core inflation. Fed funds futures now price in a 63% chance of rate cuts by June, with the market essentially betting that policymakers will prioritize fighting unemployment over price stability. This creates ideal conditions for what analysts term “liquidity escape velocity”—the point where fiat debasement fears overwhelm short-term risk aversion.
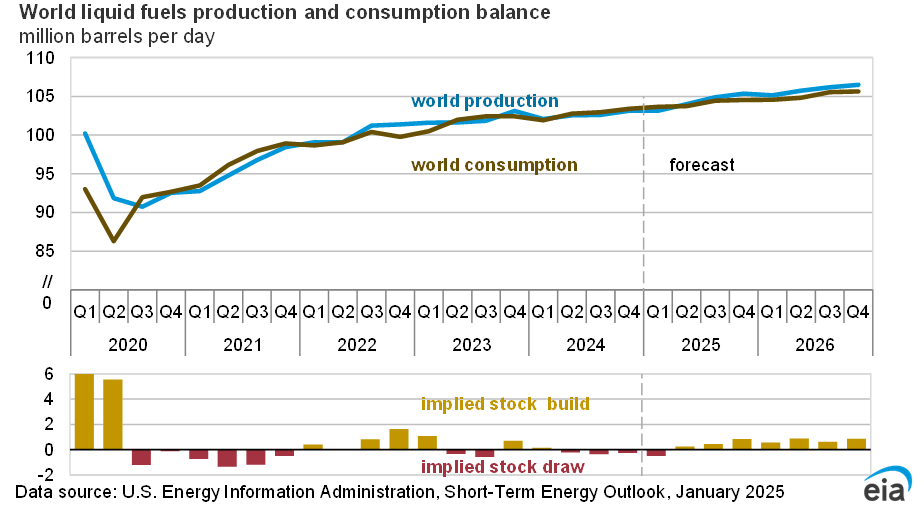
Institutional behavior confirms this thesis. Bitcoin ETF inflows in December 2024 alone absorbed 3.7 times the network’s new coin production, while corporate treasuries added a record 59,700 BTC—equivalent to 4.3 months of mining output. The resulting supply squeeze has pushed the illiquid supply ratio to its highest level since the 2021 bull market.
The Divergence Dilemma
Beneath these bullish indicators lurks a concerning divergence. While on-chain fundamentals scream scarcity—exchange balances have plummeted to 2018 levels—macro headwinds are intensifying. The December 2024 FOMC meeting proved particularly damaging, as a hawkish 25 basis point cut (accompanied by upwardly revised “dot plot” projections) triggered the sharpest dollar rally in nine months.
This created what market technicians call a “liquidity choke point.” The DXY dollar index’s 6% surge since the Fed meeting has contracted global money supply growth to just 1.2% annualized—below the threshold historically associated with Bitcoin bull markets. Perhaps most worryingly, Bitcoin’s 60-day correlation with the S&P 500 remains elevated at 0.75, leaving it vulnerable to any repricing of growth assets.
The $200,000 Question
Against this backdrop, analysts are parsing two competing narratives:
- The Deficit Doom Loop: With U.S. debt service costs now consuming 42% of tax revenues and demographic pressures accelerating, fiscal dominance appears inevitable. “You can’t taper a Ponzi,” quips one analyst, noting that even 2% Treasury yields would add $400 billion annually to deficits. This structural backdrop favors hard assets, with several models suggesting Bitcoin’s market cap could capture 5-10% of global “scarcity premium” flows within five years.
- The Liquidity Trap: Should the Fed delay cuts amid stagflation, Bitcoin could face a replay of 2022’s deflationary collapse. Technical analysts flag the $82,000 level as critical support—a breach there would invalidate several cycle progression models.
Market participants appear to be hedging both scenarios. Options open interest shows growing demand for $200,000 December 2025 calls, while the put/call ratio has quietly reached its most defensive level since the COVID crash. This bifurcation reflects what one trader describes as “the ultimate volatility setup”—a market pricing in both monetary catastrophe and policy salvation simultaneously.
The New Cycle Playbook
What emerges is a portrait of Bitcoin’s maturation. The asset still responds to macro shocks, but with diminishing beta to risk assets and growing sensitivity to monetary policy errors. The four-year cycle hasn’t disappeared so much as evolved—today’s bull runs are less about retail mania than institutional accumulation against a backdrop of fiscal deterioration.
For investors, this suggests a strategy shift: rather than timing halvings, the new playbook involves monitoring liquidity indicators (global M2, reverse repo balances) and institutional flow patterns. As one report concludes: “When the Treasury market sneezes, Bitcoin catches a cold—but when the dollar system fever breaks, it may be the only asset left standing.”
The coming months will test whether Bitcoin can maintain its precarious balance between macro casualty and monetary lifeboat. With $6.2 trillion in global negative-yielding debt and central banks facing their greatest credibility crisis since the 1970s, the stage is set for either Bitcoin’s validation as a hedge asset—or its most brutal efficiency test yet.
Sources:
- Lyn Alden’s “Bitcoin Market Outlook and Macro Insights”
- Cointelegraph’s “Bitcoin Eyes Gains as Macro Data Makes US Recession Base Case” (May 2025)
- Bitwise’s “Balancing On-Chain Tailwinds With Macro Headwinds” (January 2025)
- CME FedWatch Tool, The Kobeissi Letter, NilssonHedge, Truflation, Philadelphia Fed reports